Fig. 3
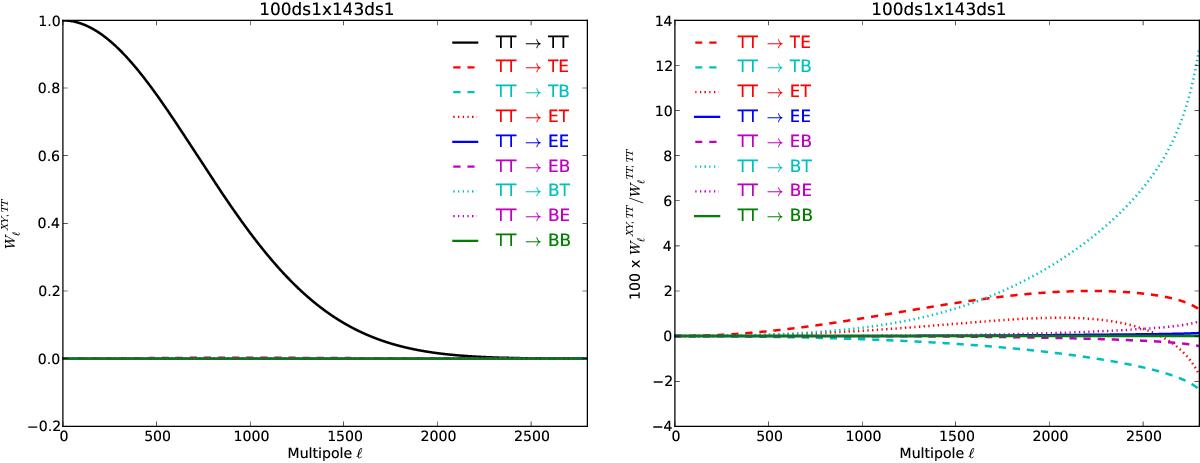
Effective beam window matrix ![]() introduced in Eq. (41) and detailed in Eq. (E.8a), for the cross-spectra of two simulated Planck maps discussed in Sect. 5. Left panel: raw elements of
introduced in Eq. (41) and detailed in Eq. (E.8a), for the cross-spectra of two simulated Planck maps discussed in Sect. 5. Left panel: raw elements of ![]() , showing for each ℓ how the measured XY map angular power spectrum is impacted by the input TT spectrum, because of the observation of the sky with the beams. Right panel: blown-up ratio of the non-diagonal elements to the diagonal ones: 100 WXY,TTℓ/WTT,TTℓ
, showing for each ℓ how the measured XY map angular power spectrum is impacted by the input TT spectrum, because of the observation of the sky with the beams. Right panel: blown-up ratio of the non-diagonal elements to the diagonal ones: 100 WXY,TTℓ/WTT,TTℓ
Current usage metrics show cumulative count of Article Views (full-text article views including HTML views, PDF and ePub downloads, according to the available data) and Abstracts Views on Vision4Press platform.
Data correspond to usage on the plateform after 2015. The current usage metrics is available 48-96 hours after online publication and is updated daily on week days.
Initial download of the metrics may take a while.