| Issue |
A&A
Volume 598, February 2017
|
|
|---|---|---|
| Article Number | A92 | |
| Number of page(s) | 26 | |
| Section | Galactic structure, stellar clusters and populations | |
| DOI | https://doi.org/10.1051/0004-6361/201629410 | |
| Published online | 07 February 2017 | |
New ultracool subdwarfs identified in large-scale surveys using Virtual Observatory tools ⋆,⋆⋆,⋆⋆⋆,⋆⋆⋆⋆,†
II. SDSS DR7 vs. UKIDSS LAS DR6, SDSS DR7 vs. UKIDSS LAS DR8, SDSS DR9 vs. UKIDSS LAS DR10, and SDSS DR7 vs. 2MASS
1 Instituto de Astrofísica de Canarias, C/vía Láctea s/n, 38200 La Laguna, Tenerife, Spain
e-mail: This email address is being protected from spambots. You need JavaScript enabled to view it.
2 Departamento de Astrofísica, Universidad de La Laguna, 38206 La Laguna, Tenerife, Spain
3 Centro de Astrobiología (CSIC-INTA), Ctra. Ajalvir km 4, 28850 Torrejón de Ardoz, Madrid, Spain
4 Centro de Astrobiología (INTA-CSIC), Departamento de Astrofísica, PO Box 78, 28691 Villanueva de la Cañada, Madrid, Spain
5 Spanish Virtual Observatory, Madrid, Spain
Received: 27 July 2016
Accepted: 21 September 2016
Abstract
Aims. We aim to develop an efficient method to search for late-type subdwarfs (metal-depleted dwarfs with spectral types ≥M5) to improve the current statistics. Our objectives are to improve our knowledge of metal-poor low-mass dwarfs, bridge the gap between the late-M and L types, determine their surface density, and understand the impact of metallicity on the stellar and substellar mass function.
Methods. We carried out a search cross-matching the Sloan Digital Sky Survey (SDSS) Data Release 7 (DR7) and the Two Micron All Sky Survey (2MASS), and different releases of SDSS and the United Kingdom InfraRed Telescope (UKIRT) Infrared Deep Sky Survey (UKIDSS) using STILTS, Aladin, and Topcat developed as part of the Virtual Observatory tools. We considered different photometric and proper motion criteria for our selection. We identified 29 and 71 late-type subdwarf candidates in each cross-correlation over 8826 and 3679 sq. deg, respectively (2312 sq. deg overlap). We obtained our own low-resolution optical spectra for 71 of our candidates: 26 were observed with the Gran Telescopio de Canarias (GTC; R ~ 350, λλ5000–10 000 Å), six with the Nordic Optical Telescope (NOT; R ~ 450, λλ5000–10 700 Å), and 39 with the Very Large Telescope (VLT; R ~ 350, λλ6000–11 000 Å). We also retrieved spectra for 30 of our candidates from the SDSS spectroscopic database (R ~ 2000 and λλ 3800–9400 Å), nine of these 30 candidates with an independent spectrum in our follow-up. We classified 92 candidates based on 101 optical spectra using two methods: spectral indices and comparison with templates of known subdwarfs.
Results. We developed an efficient photometric and proper motion search methodology to identify metal-poor M dwarfs. We confirmed 86% and 94% of the candidates as late-type subdwarfs from the SDSS vs. 2MASS and SDSS vs. UKIDSS cross-matches, respectively. These subdwarfs have spectral types ranging between M5 and L0.5 and SDSS magnitudes in the r = 19.4–23.3 mag range. Our new late-type M discoveries include 49 subdwarfs, 25 extreme subdwarfs, six ultrasubdwarfs, one subdwarf/extreme subdwarf, and two dwarfs/subdwarfs. In addition, we discovered three early-L subdwarfs to add to the current compendium of L-type subdwarfs known to date. We doubled the numbers of cool subdwarfs (11 new from SDSS vs. 2MASS and 50 new from SDSS vs. UKIDSS). We derived a surface density of late-type subdwarfs of 0.040+0.012-0.007 per square degree in the SDSS DR7 vs. UKIDSS LAS DR10 cross-match (J = 15.9–18.8 mag) after correcting for incompleteness. The density of M dwarfs decreases with decreasing metallicity. We also checked the Wide Field Survey Explorer (AllWISE) photometry of known and new subdwarfs and found that mid-infrared colours of M subdwarfs do not appear to differ from their solar-metallicity counterparts of similar spectral types. However, the near-to-mid-infrared colours J−W2 and J−W1 are bluer for lower metallicity dwarfs, results that may be used as a criterion to look for late-type subdwarfs in future searches.
Key words: Galaxy: halo / subdwarfs / techniques: photometric / techniques: spectroscopic / surveys / virtual observatory tools
Based on observations made with ESO Telescopes at the La Silla Paranal Observatory under programmes IDs 088.C-0250(A), 090.C-0832(A).
Based on observations made with the Nordic Optical Telescope, operated by the Nordic Optical Telescope Scientific Association at the Observatorio del Roque de los Muchachos, La Palma, Spain, of the Instituto de Astrofísica de Canarias.
Based on observations made with the Gran Telescopio Canarias (GTC), installed in the Spanish Observatorio del Roque de los Muchachos of the Instituto de Astrofísica de Canarias, in the island of La Palma (programs GTC44-09B, GTC53-10B, GTC31-MULTIPLE-11B, GTC36/12B, and GTC79-14A).
The data presented in this paper are gathered in a VO-compliant archive at http://svo2.cab.inta-csic.es/vocats/ltsa/
The photometric and spectroscopic data are available at the CDS via anonymous ftp to cdsarc.u-strasbg.fr (130.79.128.5) or via http://cdsarc.u-strasbg.fr/viz-bin/qcat?J/A+A/598/A92
© ESO, 2017
1. Introduction
Subdwarfs have luminosity class VI in the Yerkes spectral classification system and lie below the main-sequence in the Hertzsprung-Russell diagram (Morgan et al. 1943). Subdwarfs appear less luminous than solar metallicity dwarfs with similar spectral types, due to the lack of metals in their atmospheres (Baraffe et al. 1997). They have typical effective temperatures (Teff) between ~2500 and 4000 K, interval dependent on metallicity (Woolf et al. 2009). Subdwarfs are Population II dwarfs located in the halo and the thick disk of the Milky Way. They are part of the first generations of stars and can be considered tracers of the Galactic chemical history. They are very old, with ages between 10 and 15 Gyr (Burgasser et al. 2003). Subdwarfs have high proper motions and large heliocentric velocities (Gizis 1997). Similarly to ordinary main-sequence stars, stellar cool subdwarfs produce their energy from hydrogen fusion and show strong metal-hydride absorption bands and metal lines. We will use the terms subdwarfs and cool subdwarfs indistinctly when mentioning our targets. Some L dwarfs with low-metallicity features have been found over the past decade, but no specific classification exists for L subdwarfs yet.
Gizis (1997) presented the first spectral classification for M subdwarfs dividing them into two groups: subdwarfs and extreme subdwarfs. The classification was based on the strength of the TiO and CaH absorption bands at optical wavelengths. Lépine et al. (2007) updated the Gizis (1997) classification using a parameter which quantifies the weakening of the strength of the TiO band in the optical as a function of metallicity; introducing a new class of subdwarfs: the ultrasubdwarfs. The current classification of low-mass M stars includes dwarfs and three low-metallicity classes: subdwarfs, extreme subdwarfs, and ultrasubdwarfs, with approximated metallicities of −0.5, −1.0, and −2.0 respectively (Lépine et al. 2007). Jao et al. (2008) also proposed a classification for cool subdwarfs based on temperature, gravity, and metallicity.
The typical methods to identify subdwarfs focus on proper motion and/or photometric searches in photographic plates taken at different epochs (Luyten 1979, 1980; Scholz et al. 2000; Lépine et al. 2003b; Lodieu et al. 2005). Nowadays, the existence of large-scale surveys mapping the sky at optical, near-infrared, and mid-infrared wavelengths offer an efficient way to look for these metal-poor dwarfs. After the first spectral classification for M subdwarfs proposed by Gizis (1997), other authors contributed to the increase in the numbers of this type of objects. New M subdwarfs with spectral types later than M7 were published in Gizis & Reid (1997), Schweitzer et al. (1999), Lépine et al. (2003c), Scholz et al. (2004a), Scholz et al. (2004b), Lépine & Scholz (2008), Cushing et al. (2009), Kirkpatrick et al. (2010), Lodieu et al. (2012), and Zhang et al. (2013). The largest samples come from Lépine & Scholz (2008), Kirkpatrick et al. (2010), Lodieu et al. (2012), and Zhang et al. (2013) and include 23, 15, 20, and 30 new cool subdwarfs, respectively.
Burgasser et al. (2003) published the first “substellar subdwarf”, with spectral type (e?)sdL7. It was followed by a sdL4 subdwarf (Burgasser 2004) and years later by other seven L subdwarfs: a sdL3.5–4 in Sivarani et al. (2009), a sdL5 in Cushing et al. (2009), a sdL5 in Lodieu et al. (2010) (re-classified in this paper as sdL3.5–sdL4), a sdL1, sdL7, and sdL8 in Kirkpatrick et al. (2010), a sdL5 in Schmidt et al. (2010) and also in Bowler et al. (2010). Our group published two new L subdwarfs (Lodieu et al. 2012). In this work we add three more, with spectral types sdL0 and sdL0.5. The coolest L subdwarfs might have masses close to the star-brown dwarf boundary for subsolar metallicity according to models (Baraffe et al. 1997; Lodieu et al. 2015).
The main purpose of this work is to develop an efficient method to search for late-type subdwarfs in large-scale surveys to increase their numbers using tools developed as part of the Virtual Observatory (VO)1 like STILTS2 (Taylor 2006), Topcat3 (Taylor 2005), and Aladin4 (Bonnarel et al. 2000). We want to improve our knowledge of late-type subdwarfs, bridge the gap between late-M and L spectral types, determine the surface densities for each metallicity class, and understand the role of metallicity on the mass function from the stellar to the sub-stellar objects.
This is the second paper of a long-term project with several global objectives. The first paper was published in Lodieu et al. (2012), where we cross-matched SDSS DR7 and UKIDSS LAS DR5, reporting 20 new late-type subdwarfs. In this second paper, we present the second part of our work, reporting new subdwarfs identified in SDSS DR9 (York et al. 2000), UKIDSS LAS DR10 (Lawrence et al. 2007), and 2MASS (Cutri et al. 2003; Skrutskie et al. 2006).
2. Sample selection of late-type subdwarfs
We carried out two main cross-matches using different data releases of SDSS, UKIDSS, and 2MASS: on the one hand SDSS DR9 vs. UKIDSS LAS DR10, and, on the other hand SDSS DR7 vs. 2MASS. The area covered by these cross-matches are 3679 and 8826 sq. deg, respectively. We emphasise that the candidates from the SDSS vs. UKIDSS cross-matches in earlier releases are recovered in the SDSS DR9 vs. UKIDSS LAS DR10 cross-correlation. The common area between SDSS DR9 vs. UKIDSS LAS DR10 and SDSSDR7 vs. 2MASS amounts for 2312 sq. deg. The baseline in these cross-matches oscillates between approximately one and seven years, which corresponds to the maximum temporal separation between SDSS DR7 and 2MASS.
All the candidates in this paper followed a search workflow that consisted in four main steps detailed here for the SDSS vs. UKIDSS cross-correlation. We performed the search in SDSS and 2MASS using the same method with equivalent criteria:
-
Astrometric criteria: for each SDSS source we looked for UKIDSS couterparts at radii between 1 and 5 arcsec. The nearest counterpart was kept. A minimum distance of 1 arcsec between the UKIDSS and SDSS source was required. We selected point sources in SDSS (cl = 6), and in UKIDSS (mergedClass equal to −1 or −2).
-
Quality flag criterion: for J and K, we used the quality flags ppErrBits ≤ 256, and Xi and Eta between −0.5 and 0.5 (these parameters refer to positional matching).
-
Photometric criteria: J > 10.5 mag and K > 10.2 mag (to avoid bright sources), with r−i ≥ 1.0, g−r ≥ 1.8, r−z ≥ 1.6, and J−K ≤ 0.7 mag.
-
Reduced Proper Motion criterion: Hr ≥ 20.7 mag, where Hr = r + 5× log (μ) + 5, where μ is the proper motion (in arcsec/yr) and Hr the reduced proper motion.
We sought late-type subdwarfs with spectral types later than M5 in the solar vicinity. Here we consider the same criteria employed in Lodieu et al. (2012); these criteria are also comparable to those of previous surveys (Jones 1972; Evans 1992; Salim & Gould 2002; Scholz et al. 2004b; Lépine & Shara 2005; Burgasser et al. 2007; Lépine & Scholz 2008; Lodieu et al. 2009).
We present the final list of 100 late-type subdwarf candidates in Table A.1: 29 candidates come from the SDSS vs. 2MASS exploration, and 71 candidates from SDSS vs. UKIDSS. Table A.1 provides the objects’ coordinates, the optical ugriz magnitudes from SDSSS DR9 for all 100 candidates, the near-infrared magnitudes given by the catalogues used in the corresponding searches (i.e. 2MASS for candidates found in the SDSS vs. 2MASS, and UKIDSS for those registered from the SDSS vs. UKIDSS survey), proper motions, and reduced proper motions. We also list in the first column of Table A.1 an identification number (ID) that will be used throughout this paper to designate the candidates. Objects with ID between 1 and 29 were selected from the SDSS DR7 vs. 2MASS search. The remaining candidates selected from the different SDSS vs. UKIDSS cross-matches have IDs between 30 and 100 as follows: IDs 30 to 42 were selected from the SDSS DR7 vs. UKIDSS LAS DR6 cross-match, IDs 43 to 60 from SDSS DR7 vs. UKIDSS LAS DR8, and IDs 69 to 100 from SDSS DR7 vs. UKIDSS LAS DR10.
For the astrometric cross-match exercise we used the Aladin tool. We set a miniminum separation of 1 arcsec between epochs to ensure that our candidates have significant proper motion. We inspected all 100 candidates by eye in the images from SuperCOSMOS Sky Surveys Hambly et al. (2001c,b,a) for additional epochs to exclude false positives. We calculated the proper motions by considering the direct differences in the right ascensions and declinations given by the catalogues and their respective observing epochs. We provide these values in Table A.1, which we used to determine the reduced proper motions. We revise some proper motion measurements in Sect. 3 primarily to identify solar-metallicity M dwarf contaminants in our sample. The 100 candidates exhibit total proper motions between ~0.1 and ~1.9 arcsec/yr.
Scholz et al. (2004b) presented the idea of a generic photometric search for metal-poor dwarfs, where the (J−K, i−J) colour–colour diagram could be useful to separate subdwarfs from their solar-metallicity counterparts. We placed our 100 candidates in the colour–colour diagram of Fig. 1 using the UKIDSS Vega system photometry (Hewett et al. 2006). Five candidates (ID = 1, 2, 6, 10, and 19) from the SDSS vs. 2MASS survey also have UKIDSS photometry: the typical differences between the 2MASS and UKIDSS magnitudes are ±0.05 mag, ±0.06 mag, and ±0.10 mag in the J, H, and K filters, respectively. In Fig. 1, we plot the UKIDSS photometry of these candidates while the objects from the SDSS DR7 vs. 2MASS cross-match without UKIDSS photometry are plotted with their 2MASS magnitudes transformed to the UKIDSS system using the prescription of Hewett et al. (2006). A few candidates show J−K > 0.7 mag, which does not comply with our photometric criteria. We classified objects with ID = 10 and ID = 19 as dM/sdM, ID = 2 as a confirmed solar-metallicity dM3 dwarf, and ID = 1 as late-type sdM6 dwarf (two spectra available). We note that the candidates with the latest spectral classification show red i−J colours as expected for late-M dwarfs (Hawley et al. 2002; West et al. 2005).
The reduced proper motion represents our main astrometric criterion. It is a key parameter when searching for late-type subdwarfs. Figure 2 displays the Hr as a function of r−z for the objects included in the Lépine & Shara (2005) catalogue (using their SDSS photometry). As shown in Lépine & Scholz (2008), we can easily distinguish three sequences: white dwarfs on the left, low-metallicity dwarfs or subdwarfs in the middle, and solar-metallicity dwarfs on the right. In Fig. 2 we overplotted our candidates and the known subdwarfs from the literature as in Fig. 1. The majority of the 100 candidates fit well the expected sequences of low metallicity dwarfs.
 |
Fig. 1 (i−J vs. J−K) colour–colour diagram for candidates with optical spectra. Symbols are as follows: sdM/L (filled red squares), esdM (filled green circles), usdM (filled blue triangles), candidates with uncertain class (filled black upside down triangles), and solar-metallicity M dwarfs (filled black diamonds). The empty five pointed stars represent the 14 candidates without optical spectroscopy yet. We also included a few known subdwarfs, extreme subdwarfs, and ultrasubdwarfs published in the literature (empty symbols). The empty diamonds joined with a continuum line in the right part of the diagram are solar-metallicity M dwarfs from West et al. (2008). The J and K magnitudes of candidates with ID = 1–29 are in the UKIDSS Vega system (Hewett et al. 2006), except for objects with ID = 1, 2, 6, 10, 11, and 19, which are plotted with their original 2MASS photometry. |
 |
Fig. 2 Reduced proper motion diagram of new subdwarfs and solar-metallicity M dwarfs. Hr was computed using the proper motions obtained from the positions and epochs of the cross-matched catalogues. Same symbology as Fig. 1 for our candidates. Small grey dots correspond to objects from Lépine’s catalogue with SDSS photometry Lépine & Shara (2005). |
3. Proper motion revision: discarding solar-metallicity dwarfs
To reject potential false candidates in our sample, we refined the proper motions by performing accurate astrometric studies of the bi-dimensional images retrieved from the surveys. We carried out this work with IRAF5 (Tody 1986, 1993) with the tasks daofind, xyxymatch, geomap, and geoxytran. The task daofind selects the good sources in each image, xyxymatch matches the two lists of targets selected from each image and generated by daofind, geomap gives a transformation equation to convert one set of coordinates into the other set, and geoxytran transforms the coordinates from one epoch to the other.
To obtain more accurate proper motions for our candidates, we considered their physical positions (X and Y, in pixels) and the observing dates of each survey. This process requires at least 30 reference stars in common between the images to obtain a reasonable fit with geomap. This method assumes that reference stars are background stars with negligible motions. Contrary to the VO, we considered the positions of the objects in the two dimensional images rather than the catalogue coordinates of these stars. We calculated the offsets in pixels between the two epochs and later converted pixels into arcsec with the corresponding plate scale. At the end of the process, we obtained new proper motion estimates (in ′′/yr) in right ascension and declination.
We revised the proper motions with this method only for the 71 candidates with ID between 30 and 100 coming from the multiple SDSS vs. UKIDSS cross-matches. The mean difference between the refined proper motions and the proper motions calculated with VO tools is 0.029 arcsec/yr with a rms of 0.012 arcsec/yr. We could not refine the proper motion for the candidates in the SDSS vs. 2MASS cross-match because of a poor fit mainly due to the low spatial resolution of the 2MASS images and the low number of sources in common to the SDSS images.
Among the 71 candidates with refined proper motions, only the ID = 70 has a refined value of Hr below 20.7 mag (Col. 7 in Table A.2), indicating that it is a potential contaminant. We confirm spectroscopically the solar-metallicity nature of this object and classify it as a dM5.0 ± 0.5. The other object that could be considered as a contaminant is ID = 37, with Hr between 20.26 and 21.43 mag. This candidate remains without optical spectrum, but we keep it as a subdwarf candidate because its Hr overlaps with our original criterion. Therefore, the object with ID = 70 is the only one out of 71 candidates that could have been rejected prior to our follow-up – it only represents 1% of our sample. We conclude that the Hr from the VO are very reliable for the SDSS vs. UKIDSS sample.
For the 29 candidates from the SDSS vs. 2MASS cross-match, we looked for proper motions in the PPMXL catalogue (Roeser et al. 2010), where we found 16 with IDs between 7 and 29 (Table A.2). The mean difference between the proper motions in the PPMXL catalogue and the proper motions calculated with VO tools is 0.128 arcsec/yr. We re-calculated their Hr values using the proper motions from the PPMXL catalogue and found two distinct cases. Firstly three of these 16 candidates would have Hr < 20.7 mag (objects with ID = 14, 22, and 24), so they would not pass our original criterion in Hr. Therefore, they should not be in our sample using the PPMXL proper motions. Nevertheless, we confirmed spectroscopically these objects as late-type subdwarfs. Checking the 2MASS and SDSS images, we see a clear motion for ID = 22, so we trust the proper motion calculated by the VO. For ID = 14 we see a second object close to our subdwarf in the SDSS image but not in the 2MASS image, which may result in a false match either in the PPMXL or VO catalogue. In the case of ID = 24, the motion is small and the 2MASS coordinates are not well centred on the object, suggesting that the proper motion calculated by the VO may be overestimated. Secondly, thirteen of these 16 candidates would have Hr ≥ 20.7 mag, so they would pass our original criterion and be in our sample. We classify spectroscopically two of these 16 candidates (ID = 13 and 27) as solar-metallicity M dwarfs.
We collected our optical spectra before checking the PPMXL catalogue so that our sample was defined using the total proper motion calculated by the VO, reason why we have spectra for all 29 candidates from the SDSS DR7 vs. 2MASS cross-match. Table A.2 provides the new proper motion determinations: those derived from the cross-correlation of 2D images for objects with ID = 30 through 100, and those obtained from the PPMXL catalogue for candidates with IDs between 7 and 29.
4. Optical spectroscopic follow-up and data reduction
We obtained long-slit optical spectra with different telescope and instrument configurations. We observed in service mode under grey time, clear conditions, and at parallactic angle with the moon further away than 30 degrees from our targets. In Table A.3 we give exposure times as well as seeing and airmass at the time of the observations for our own spectroscopic follow-up of 71 candidates, excluding the spectra downloaded from the SDSS spectroscopic database. We reduced all optical spectra under the IRAF environment (Tody 1986, 1993). We removed the median-combined bias, divided by the normalised dome flat, extracted optimally the spectra, calibrated in wavelengths using arc lamps, and corrected for instrumental response with a spectrophotometric standard star observed on the same night as the targets. We normalised all the spectra displayed in Figs. 4 and 5 at 7500 Å. We note that only the SDSS spectra are corrected for telluric absorptions.
We have designed an ultracool subdwarf archive containing the new subdwarfs presented in this paper, and known subdwarfs with optical spectral types later than (or equal to) M5 from the literature. The archive is compliant with the VO standards as described in Appendix B6. We provide coordinates, photometry, proper motions, and spectra of our subdwarfs in Appendix B.
4.1. GTC/OSIRIS spectra
We observed 26 candidates with the Optical System for Imaging and low Resolution Integrated Spectroscopy (OSIRIS; Cepa et al. 2000) instrument on the 10.4 m Gran Telescopio de Canarias (GTC) between January 2010 and July 2014. The GTC is located in the Roque de Los Muchachos Observatory, in the island of La Palma, Spain. OSIRIS has an unvignetted field of view of 7 × 7 arcmin. The detector of OSIRIS consists of a mosaic of two Marconi CCD42-82 (2048 × 4096 pixels) with a 74 pixel gap between them. The pixel physical size is 15 μm, which corresponds to a scale of 0.254 arcsec on the sky, for a detector binned by a factor two, used for our long-slit spectroscopic follow-up.
We obtained optical spectra with a resolution of R ~ 350 at ~720 nm using the grism R500R and a slit of 1 arcsec, covering the 5000–10 000 wavelength range with a dispersion of 4.7 Å/pixel. We calibrated the spectra in wavelength with a rms of 0.5 Å using arc lamps (HgAr, Xe, Ne) acquired the nights when the targets were observed.
In addition to the M subdwarfs, we obtained a new optical spectrum of ULAS J135058.86+081506.8 (Lodieu et al. 2010) on 25 January 2014 with GTC OSIRIS and a slit of 1.5 arcsec as part of a filler programme (GTC65-13B; PI Lodieu). The conditions were clear with dark skies but the seeing worse than 2 arcsec. We collected three optical spectra of 920 s shifted along the slit to remove cosmic rays and detector defects. The reduced 1D spectrum is shown in Fig. 3, along with the known sdL4 subdwarf 2MASS162620.35+392519.0 (Burgasser 2004; Burgasser et al. 2007). Both spectra look quite similar within the spectroscopic uncertainties (Fig. 3), thus confirming the metal-depleted nature of ULAS J135058.86+081506.8 and a spectral type of sdL3.5–sdL4, slightly warmer than our previous classification based on a poorer spectrum (Lodieu et al. 2010).
 |
Fig. 3 Improved GTC OSIRIS low-resolution optical spectrum of ULAS J13505886+0815068. The spectrum of the known sdL4 2MASS J16262035+3925190 from Burgasser (2004), Burgasser et al. (2007) is overplotted. |
 |
Fig. 4 Low-resolution optical spectra for 38 candidates confirmed as M and L subdwarfs (black) with their identifier (ID) and telescope name. Overplotted in red are subdwarf spectral templates from SDSS used to assign the final spectral types (see Sect. 5.2). Candidates with ID = 1, 8, and 83 appear twice, because they have spectra from our own follow-up and from the SDSS spectroscopic database. |
4.2. NOT/ALFOSC spectra
We observed six candidates with the ALFOSC (Andalucia Faint Object Spectrograph and Camera) instrument on the 2.5 m Nordic Optical Telescope (NOT) in the island of La Palma between January and August 2009. ALFOSC has a charge coupled device CCD42-40 non-inverted mode operation back illuminated of 2048 × 2052 pixels and has a field of view of 6.4 × 6.4 arcmin. The pixel size and plate scale are 13.5 μm and 0.19 arcsec/pixel respectively. We secured optical spectra at a resolution of R ~ 450 using the grism number five and a slit width of 1 arcsec, except for candidates with IDs 25 and 26 where we used a slit of 1.2 arcsec, covering a wavelength range between 5000–10 700 Å with a dispersion of 16.8 Å/pixel. We calibrated the spectra in wavelength with a rms better than 0.2 Å using arc lamps (He, Ne, Ar) obtained on the same nights as the targets.
4.3. VLT/FORS2 spectra
We observed 39 candidates with the visual and near UV FOcal Reducer and low dispersion Spectrograph (FORS2; Appenzeller et al. 1998) instrument on the 8.2 m (Unit Telescope 1) Very Large Telescope (VLT) between January 2012 and March 2013. The VLT is located in Cerro Paranal, in the north of Chile. FORS2 is equipped with a mosaic of two 2k × 4k MIT CCDs (with 15 μm pixels) and has a field of view of 6.8 × 6.8 arcmin with the standard resolution collimator (SR) providing an image scale of 0.25 arcsec/pixel in the standard readout mode (2 × 2 binning). We obtained optical spectra at a resolution of R ~ 350 using the grism 150I+27 with a slit width of 1 arcsec and the order blocking filter OG590 covering a wavelength range 6000–11 000 Å with a dispersion of 3.45 Å/pixel. We used arc lamps (He, Ne, Ar) to calibrate the spectra in wavelength the spectra with a rms of ~0.4–0.6 Å.
4.4. Optical spectra from the SDSS spectroscopic database
We queried the SDSS spectroscopic database to search for spectra of our candidates. These optical spectra have R ~ 2000 and cover the range 3800–9400 Å. We found that 30 of our candidates have a SDSS spectrum, nine of them in common with our own spectroscopic follow-up at GTC/OSIRIS, NOT/ALFOSC, or VLT/FORS2. These nine objects appear twice in Table A.5 and serve to double-check our spectral classification. The remaining 21 candidates with a SDSS spectrum appear only once in Table A.5. All spectra are shown in Figs. 4 and 5.
5. Spectral classification
We used two methods to classify spectroscopically our subdwarf candidates. On the one hand, we classified subdwarfs with the method based on spectral indices presented by Lépine et al. (2007). These indices measured the strength of the TiO band at 7126–7138 Å and the CaH bands at 6380–6390 Å, 6814–6846 Å, and 6960–6990 Å. On the other hand, we considered spectra of known M and L subdwarfs, downloaded from the SDSS spectroscopic database and from the literature, as templates to compare visually with the spectra of our candidates. However, during preparation of this paper, Savcheva et al. (2014) published templates for subdwarfs (M0–M9.5), extreme subdwarfs (esM0–esM8), and ultra-subdwarfs (usdM0–usdM7.5), which we will use to classify our targets.
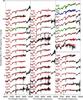 |
Fig. 5 Low-resolution optical spectra for our candidates (black) with identifier (ID) and telescope name. Overplotted in red, green, and blue are the spectral templates of SDSS dwarfs/subdwarfs used to assign the final spectral types (see Sect. 5.2 and legend on the plot). First and second columns: 26 candidates confirmed as extreme subdwarfs. Third column, lower part: six candidates confirmed as ultrasubdwarfs. Third column, upper part: five candidates classified as dM and two candidates with uncertain class, between dM and sdM. Candidates with IDs 5, 9, 11, 15, and 7 appear twice because they were included in our spectroscopic follow-up and have a spectrum in the SDSS spectroscopic database. |
5.1. Spectral classification according to indices
In Cols. 2 to 5 of Table A.5, we list the values of the spectral indices calculated from the equations in Lépine et al. (2007). We list the associated spectral types from the scheme of Lépine et al. (2007) in Col. 6 of Table A.5. These spectral types have an uncertainty half a subtype because we approximated the values to the nearest half decimal (e.g. a sdM6.76 was approximated to sdM7.0 and the final spectral type is sdM7.0 ± 0.5).
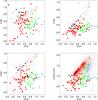 |
Fig. 6 Distribution of subdwarfs as a function of their spectral indices. Symbols are as in Fig. 1. The bottom right plot shows the CaH2+CaH3 vs. TiO5 diagram for objects classified as sdM, esdM, or usdM (small diamonds in red, green, and blue, respectively) in the SDSS spectroscopic database. Plots originally presented in Gizis (1997) and Lépine et al. (2007), updated with our discoveries. |
 |
Fig. 7 Spectral indices (CaH1, CaH2, CaH3, and TiO5) vs. the final spectral types for our subdwarfs, extreme subdwarfs, ultrasubdwarfs, and solar-metallicity dwarfs plotted as filled squares, circles, triangles, and diamonds respectively. |
In Fig. 6 we plot the spectral indices of Gizis (1997) to assign spectral types to our targets within the framework of the classification of Lépine et al. (2007): CaH1, CaH2, CaH3, and CaH2+CaH3 vs. TiO5. In the CaH2+CaH3 vs. TiO5 diagram, we also plot objects classified as sdM, esdM, or usdM in the SDSS spectroscopic database. We can distinguish three sequences in the lower right diagram in Fig. 6 because most SDSS subdwarfs have spectral types earlier than M5. Our subdwarfs, on the other hand, are mainly late-M subdwarfs so they do not lie exactly on top of the three sequences. We see that some of our contaminants are located in the overlapping regions between dwarfs and subdwarfs because the separation is not perfectly defined (Lépine et al. 2007).
We can appreciate the presence of four reasonably well-defined sequences corresponding to solar metallicity dwarfs, subdwarfs, extreme subdwarfs, and ultrasubdwarfs in all four panels of Fig. 6. According to the literature, this represents the distinct sub-solar abundances where the ultrasubdwarfs are the most metal-depleted stars. In our sample, the intensity of CaH seems to keep similar values for all subdwarf categories, which contrasts with the behaviour of TiO, which becomes less intense with decreasing metallicity. Actually, a TiO index of ~1.0 implies that this oxide feature is barely seen at the resolution of our data. The lack of TiO absorption in high-gravity, late-type atmospheres is an excellent indicator of extreme sub-solar metallicity.
In Fig. 7 we show the spectral indices as a function of the adopted spectral type. We argue that CaH1 is the worst indicator of spectral type and metallicity class. CaH2 and CaH3 are good indicators of spectral type but poor indicator of metallicity class. TiO5 is a good indicator of metallicity class.
5.2. Spectral classification according to visual comparison with spectral templates
To perform a classification with spectral templates, we used the templates made publicly available by Savcheva et al. (2014). Their sample include templates every subtype for sdM0–sdM9.5, esdM0–esdM8, and usdM0–usdM7.5 for subdwarfs, extreme subdwarfs, and ultrasubdwarfs, respectively. In Col. 7 of Table A.5, we list the final spectral types of our candidates with an uncertainty of half a subtype based on spectral templates.
We should emphasise that we performed our own spectral library before the publication of Savcheva et al. (2014). The results obtained with both libraries agree to within half a subtype or better. We proceeded as follows: we downloaded the optical spectrum of the brightest object of each spectral type (from M0 to the latest M subtype available) for the three classes of subdwarfs and for the solar-metallicity M dwarfs from the SDSS spectroscopic database. Our spectral templates obtained from the SDSS spectroscopic database cover the following ranges: sdM0.0 to sdM8.5, esdM0.0 to esdM8.0, and usdM0.0 to usdM7.5. We smoothed some of the SDSS spectra in particular the esdM8.0 and sdM7.5 templates. We also smoothed some of the SDSS spectra of our candidates as well as the spectrum of our faintest candidates (ID = 32). The classification of these spectra was done by SDSS under the Lépine et al. (2007) scheme.
In addition, we considered the sdL0.0 and sdL0.5 subdwarf from our previous paper (Lodieu et al. 2012) to extend the spectral library. We also downloaded spectra from the SpeX spectral libraries7 for a sdL4.0, a sdM9.5 (Burgasser 2004), a sdM9.0 (Burgasser et al. 2004a), and a sdL3.5 (Burgasser et al. 2009) which we used as template after smoothing by a factor of three. These libraries contain roughly 1000 low-resolution, near-infrared spectra of low-temperature dwarf stars and brown dwarfs obtained with the SpeX spectrograph8 (Rayner et al. 2003) mounted on the 3 m NASA InfraRed Telescope Facility (IRTF) on Mauna Kea, Hawaii. They also cover part of the optical wavelengths, redwards of 0.8 μm, which we considered as part of our spectroscopic templates. We did this classification by visually comparing the spectra of our candidates with all our templates of each class and spectral type: dM, sdM, sdL, esdM, and usdM from M0 to the latest available spectral type.
5.3. Differences between the two classification systems
 |
Fig. 8 Spectral types based on spectral templates and the spectral types derived from the indices defined by Lépine et al. (2007). We used the same symbology as in Fig. 1. We observe a trend where spectral templates lead to later spectral types compared to the classification based on spectral indices. We also highlighted confirmed metal-poor dwarfs with discrepant classes (not only spectral types) derived from both systems (asterisks). |
As has already been pointed out in Lodieu et al. (2012), we find that the spectral types derived from spectral indices tend to under-estimate the spectral type (overestimate the effective temperature) of the objects (Fig. 8). For this reason, we adopted the direct and visual comparison with SDSS templates from Savcheva et al. (2014) to assign spectral types to our candidates because it provides a more accurate and standardised classification that can be extended to cooler L-type subdwarfs. We note that the spectral indices are not so reliable to classify subdwarfs because they rely on a narrow wavelength range (10 to 30 Å typically, see Gizis 1997) and depend strongly on the spectral resolution, as discussed in Lépine et al. (2007). Although we used both methods to classify our candidates, the final spectral types used in this work come from the direct comparison with spectral templates from Savcheva et al. (2014; Col. 7 in Table A.5; Figs. 4 and 5).
Comparing the spectral classification derived by the two methods (Cols. 6 and 7 of Table A.5), we generally obtain the same metallicity class but a later spectral type using spectral templates. Nevertheless, some candidates turned out to have different classes in both systems. These discrepancies in the metallicity class occurs in ~41% of the cases (Table A.5). In Fig. 8 we compare both schemes where the aforementioned trend can be visualised: the direct comparison with spectral templates give later spectral types for candidates with the same metallicity class. We also added confirmed late-type subdwarfs with different classes in the classification systems (asterisks in Fig. 8).
Finally, the spectral sequence shown in Figs. 4 and 5 appears to be more consistent than the sequence provided by the spectral indices. A clear example is the classification of our new L subdwarfs, which would be classified as a M subdwarfs based on spectral indices only.
6. Results of the search
6.1. New late-type subdwarfs
We obtained our own optical spectra for 71 of our 100 candidates and 30 spectra from the SDSS database, including nine in common. Eight candidates resulting from the cross-matches between SDSS and UKIDSS remain without optical spectra (ID = 37, 73, 74, 75, 76, 80, 81, 84). Except for ID = 37 (identified in the SDSS DR7 vs. UKIDSS LAS DR6 cross-match), they all come from SDSS DR9 and UKIDSS LAS DR10. Twenty five of these 92 with optical spectra presented here were already reported in the literature with one or more spectral type estimates. Most of these have spectra in the SDSS spectroscopic database and we include them in this paper because they are part of our full sample (Table A.1). Nevertheless, 22 out of 24 were published as solar-metallicity M dwarfs (West et al. 2008), but we confirm spectroscopically their metal-poor nature in this work, some of them already reported as metal-poor by other groups too. We summarise below the publications and the associated spectral types (given in parenthesis):
-
One candidate from Gizis (1997):ID = 25 (esdM5.0).The spectral type agrees with ours: we classify this object as anesdM5.5 ± 0.5.
-
Five candidates from Lépine & Scholz (2008): ID = 16 (esdM7.5), 31 (sdM7.5), 17 (sdM8.0), 79 (sdM8.5), and 23 (esdM7.0). We classify these objects with SDSS templates (Table A.5). Our spectral types agree with the aforementioned classification (within the uncertainty of 0.5), except for ID = 79 which we classify as a sdM6.0.
-
Two candidates from our previous work (Lodieu et al. 2012): ID = 6 (usdM5.5) and 31 (sdM8.0). After a revision of our templates, the spectral type of ID = 6 was modified, having now a spectral type adopted of esdM5.5 (Table A.5). We did a revision of the spectra used as templates and we noticed differences in some cases (different metallicity but equal spectral type). The differences in the spectra were not so clear due to the signal-to-noise ratio (S/N), so, when necessary, we defined new known subdwarfs with better quality spectra as templates. The spectra that make up the new sample of templates (used to do the visual classification) show clearer differences between the same spectral type for the different metallicity classes, and also clearer differences every 0.5 spectral type for the same metallicity. The new SDSS spectra made public by Savcheva et al. (2014) improve our classification too.
-
22 candidates in West et al. (2008): ID = 4 (M3), 5 (M4), 6 (M3), 7 (M3), 8 (M3), 9 (M4), 11 (M2), 12 (M4), 15 (M4), 17 (M4), 18 (M4), 23 (M5), 29 (M4), 31 (M5), 33 (M5), 43 (M3), 53 (M5), 67 (M4), 77 (M4), 79 (M5), 83 (M3), 85 (M4). The spectral classification was done with the HAMMER stellar spectral-typing facility (Covey et al. 2007), which does not include low-metallicity M dwarfs. In this work we confirm their low-metallicity (Table A.5).
-
Five candidates in Zhang et al. (2013): ID = 7 (usdM6), 33 (sdM6), 43 (esdM6), 67 (esdM6), and 85 (sdM6). These spectral types agree with our final classification for these objects, except for ID = 43 and ID = 85 which we classify as a sdM8.0 and esdM5.5–6.0, respectively.
Regarding the SDSS DR7 vs. 2MASS cross-correlation: we confirmed 26 out of 29 candidates as subdwarfs, extreme subdwarfs, ultra subdwarfs, or dwarfs/subdwarfs, yielding a success rate of 90%. We consider in this percentage all confirmed M and L subdwarfs of any spectral type as well as one object (ID = 19) with intermediate metallicity class (dM/sdM). We also include the two objects which we classify as early-type subdwarf: ID = 8 (sdM4.5 ± 0.5) and ID = 26 (sdM4.0 ± 0.5). The 24 candidates confirmed as late-type subdwarfs (≥M5) in this cross-match are divided up into 9 sdM, 1 dM/sdM, 12 esdM, and 2 usdM. Three candidates of this cross-match turn out to be solar-metallicity M dwarfs, hence contaminants. Since we are looking for subdwarfs with spectral types equal or later than M5, we could consider the object with ID = 26 (sdM4.0 ± 0.5) as an outlier in our sample although it is not really a contaminant because it turns out to be metal-poor). If we consider all the subdwarfs of the three classes with spectral type ≥M5 (including the subdwarf with ID = 8 classified as sdM4.5 ± 0.5), and the one dM/sdM object (since they show features of a sdM6.5), then we have 25 confirmed late-type subdwarfs, yielding a success rate of ~86%. If we want to be more strict, and not consider the dM/sdM object, class dM/sdM, then we have 24 objects and a success rate of ~83%.
From the SDSS DR9 vs. UKIDSS LAS DR10 cross-correlation: we confirmed 59 out of 63 candidates as late-type subdwarfs, yielding a success rate of ~94%. The 59 candidates confirmed as late-type subdwarfs include 34 sdM, 3 sdL, 13 esdM, 4 usdM, one sdM/esdM (ID = 68), and one (ID = 85) classified as a subdwarf and extreme subdwarf from its VLT and SDSS spectra, respectively. The four remaining candidates have solar metallicity: ID = 50 (dM6), ID = 70 (dM5), ID = 82 (dM2), and ID = 94 (dM6).
The success rates in the previous paragraphs come from the initial sample before refining the VO proper motions. If we consider the revised proper motions for the candidates with optical spectra from the SDSS vs. UKIDSS LAS cross-match, three M dwarfs (ID = 50, 82, 94) would not be discarded but one (ID = 70) would be, according to the Hr values calculated with the refined proper motions.
To summarise, we identified a total of 49 sdM, 3 sdL, 25 esdM, 6 usdM, 1 sdM/esdM, 2 dM/sdM, and 7 dM from the 92 candidates with optical spectra. We have confirmed spectroscopically 84 late-type subdwarfs (24 from SDSS and 2MASS, 60 from SDSS and UKIDSS LAS), two objects with uncertain class (dM/sdM), and one subdwarf with spectral type sdM4.0 ± 0.5. Considering 84 confirmed subdwarfs out of 92 candidates with optical spectra, we infer a success rate of ~91%, which would increase to ~93.5% if we consider the two dM/sdM objects. Of the total of 84 spectroscopically-confirmed metal-depleted dwarfs of all spectral types in this paper (not considering dM/sdM), the three subdwarf categories are populated as follows: 62–63 ± 9% (50–53 sdM/sdL), 30–31 ±6% (25–26 esdM), and 7 ± 3% (6 usdM), indicating that ultrasubdwarfs are about ten times less frequent than subdwarfs in the solar neighbourhood.
Among our confirmed late-type subdwarfs, we report three L subdwarfs: one sdL0.0 and two sdL0.5. Their spectral types were defined considering as templates the two previously L subdwarfs presented in Lodieu et al. (2012). These five subdwarfs should be added to the growing number of L subdwarfs reported in recent years (Burgasser et al. 2003; Burgasser 2004; Sivarani et al. 2009; Cushing et al. 2009; Lodieu et al. 2010; Schmidt et al. 2010; Bowler et al. 2010).
We developed a very efficient photometric and proper motion method to look for late-type subdwarfs. We doubled the number of known late-type subdwarfs and we added five new L subdwarfs.
6.2. Contamination
We have carefully measured the proper motions of the SDSS-UKIDSS cross match and we do not find significant differences with those derived using the positions in catalogues (VO). Therefore, we conclude that the VO proper motions (and reduced proper motions) are reliable and can be confidently use for the SDSS-2MASS cross-match. There are some exceptions though, detailed below for objects that turned out to be contaminants.
-
ID = 70: this is a subdwarfcandidate from the SDSS DR9 vs. UKIDSS LAS DR10cross-match that was predicted as a solar-metallicityM dwarf (hence, a contaminant) after revisionof its proper motion. The origin of the incorrect proper motioncalculated by the VO was due to a shift in the SDSS DR9 position,overestimating its proper motion. We confirm this fact afterchecking the SDSS image and loading the coordinates. Weconfirm its solar-metallicity nature with a spectral type of dM5.0± 0.5 from a GTC spectrum.
-
ID = 82: another candidate from SDSS DR9 and UKIDSS LAS DR10. This source passed the reduced proper motion criterion even after the astrometric revision of the proper motion. Yet, we classified its SDSS spectrum as dM2.0 ± 0.5 although the fit is not as good as other dM. We cannot explain why this candidate is a contaminant. However, we can discard the origin as being an erroneous proper motion because we see a clear displacement blinking the SDSS and UKIDSS images. The proper motion from the VO is similar to the refined proper motion, as are the reduced proper motion values.
-
ID = 50: a candidate from the SDSS DR7 vs. UKIDSS LAS DR9 cross-match. This source passed the reduced proper motion criterion even after the astrometric revision of the proper motion. Its total proper motion is low though. Nonetheless, its spectrum indicates that it is a solar-metallicity M6 dwarf, hence, a contaminant.
-
ID = 2: a subdwarf candidate from the 2MASS vs. SDSS DR7 cross-match without refined proper motion. We cannot confirm its proper motion as for the candidates from SDSS and UKIDSS because the error bars in the 2MASS coordinates are quite large given its faint magnitude. This is compatible with this object being a clear contaminant, which we classify as a dM3.0 ± 0.5.
-
ID = 13: another subdwarf candidate from the 2MASS and SDSS without refined proper motion. We can explain why this object turned out to be a contaminant though: we can see another object very close to our candidate in the SDSS image, not present neither in the 2MASS catalogue nor in the image. Therefore, we think that the VO used the coordinates of the neighbour object, overestimating of proper motion of this candidate. We confirmed spectroscopically its solar-metallicity and classify it as a dM4.0 ± 0.5.
-
ID = 27: another candidate from 2MASS and SDSS without refined proper motion. We see that the SDSS catalogue position differs from the centroid on the SDSS image, yielding an erroneous proper motion calculated by the VO. We confirmed spectroscopically its solar-metallicity nature and classify it as a dM4.5 ± 0.5.
6.3. Spectroscopic distances to our new subdwarfs
We estimated spectrophotometric distances for our confirmed subdwarfs (Col. 9 of Table A.5). We find a large range in distances, ranging from 50–60 pc for the closest subdwarfs and 500–600 pc for the furthest ones. We did not consider the effect of binarity on the spectrophotometric distances.
Subdwarfs in the literature with known distances.
We estimated spectrophotometric distances for part of our sample using the J-band absolute magnitudes of subdwarfs with known trigonometric distances. In Table 1 we list the spectral types, distances, J-band magnitudes, and names of the subdwarf templates employed to determine spectrophotometric distances of our sample. Trigonometric distances are missing for ultrasubdwarfs as well as for the following spectral types: sdM5.5, esdM7.5, esdM8.0, sdM8.5, sdL0.5. We used the 2MASS and UKIDSS photometry for ID = 1–29 and ID = 30–100, respectively. We did not convert the UKIDSS photometry in the 2MASS system because the correction for late-M dwarfs is of the order of 0.02–0.06 mag, much lower than the uncertainty due to spectral typing (half a subtype). To calculate the errors in distances, we propagated the errors on the distance of the subdwarf templates and the error on the J-band photometry but not on spectral type determination (typically half a subtype).
For our confirmed subdwarfs whose spectral types are not covered above, we inferred their spectrophotometric distances using the polynomial fits of the J band in Table A.2 of Zhang et al. (2013). These polynomial are only valid up to spectral types as late as M9.5 so we do not quote distances for our L subdwarfs although we can guess that the two brightest are most likely within 100 pc. We distinguished between subdwarfs and extreme subdwarfs. For the ultrasubdwarfs, we used the fits of the extreme subdwarfs, keeping in mind that their spectrophotometric distances will be upper limits if there is no inversion in the magnitude vs. spectral type relation in J. The errors quoted in Table A.5 are lower limit because they only take into account the uncertainty of half a subclass on our optical spectral classification.
Potential companions to our subdwarfs.
6.4. Search for wide companions to our subdwarfs
It is likely that there could be some true binaries in our sample of subdwarfs because the frequency of wide binaries is about 15% amongst metal poor dwarfs (Zapatero Osorio & Martín 2004). We searched for wide companions to our confirmed subdwarfs in the Hipparcos-Tycho and Gliese databases, as well as in the catalogue of Laird et al. (1988). The original search was done within a radius of 10 arcmin, which we later increased to 30 arcmin. We looked for bright stars of earlier spectral types with similar proper motions (using a maximum difference of 30%), distances, and metallicities to identify potential benchmark subdwarfs in our sample.
We did not find any bright star satisfying all criteria neither in the Gliese catalogue nor in Laird et al. (1988). In the Hipparcos catalogue, we identified a potential companion within 10 arcmin of our sdM5.5 subdwarf with ID = 24 most likely due to its low revised proper motion. The potential companion, TYC 3036-301-1, has V = 9.35 and is classified as a F5. No parallax distance exist for that source but we derive a spectroscopic distance of 140–150 pc, assuming Hipparcos distances for nearby F5V stars (van Leeuwen 2007). This distance is consistent with the spectroscopic distance of ID = 24 estimated to 143.7 ± 8.5 pc (Table A.5). However, no metallicity is available in the literature for TYC 3036-301-1 so its remains as a potential companion to our subdwarf.
We identified two other potential companions to ID = 25 and 55 within 30 arcmin based on proper motion only: TYC 3036-276-1 and TYC 268-395-1 (Table 2). However, no information is available in Simbad on their spectral types, spectroscopic distances, and metallicities. Thus, we cannot draw any conclusion on companionship at this stage.
6.5. Radial velocities
In this section we estimate heliocentric radial velocities for our sample of subdwarfs with SDSS optical spectra using some one target as reference. Due to the lack of cool subdwarfs with well-known radial velocities, we proceeded as follows.
We downloaded from the SDSS spectroscopic database a M6 dwarf (SDSS J08373760+3809585) with high S/N around the Hα line (>50) with a known radial velocity (1.1 km s-1) from West et al. (2008). We picked up a few other M6 dwarfs in this sample to check that our measurements give similar values to the ones reported by West et al. (2008) within the uncertainties. We compared one of our subdwarfs with the highest quality SDSS spectrum (ID = 29) to that M6 dwarf and considered it as our RV reference for all other subdwarfs in our sample with SDSS spectra. We inferred a radial velocity of −458 ± 19 km s-1 for ID = 29 from its SDSS spectrum (Table A.5).
Because the optical spectra of dwarfs and extreme/ultra subdwarfs are very different, we considered ID = 29 as our template to derive (relative) radial velocity for all sources with SDSs spectra. We compute radial velocities via the Fourier cross-correlation using the IRAF task fxcor. We used wide regions of the optical spectra (typically 6000–8800 Å) and the best Gaussian fits to infer the final Doppler shifts (Col. 10 in Table A.5). We list the error bars from the sole Gaussian fits (Table A.5). We should add in quadrature to these uncertainties the error on the radial velocity of the template and the SDSS wavelength accuracy of 5 km s-1. Nontheless, due to the spectral dispersion of the SDSS spectra, we estimate a lower limit of 15 km s-1 on the RV errors. We do not derive RVs for our subdwarfs with GTC, NOT, and VLT spectra whose very low spectral resolutions (four to six times worse than SDSS spectra) would most likely translate into error bars of the order of 100 km s-1.
6.6. Space motions
We estimated the Galactic space velocities of a sub-sample of our subdwarfs considering their coordinates, proper motions, estimated radial velocities, and spectroscopic distances (Table A.5) using the equations of Johnson & Soderblom (1987). The U, V, and W components are defined as positive toward the Galactic anti-centre, positive in the direction of Galactic rotation, and positive toward the North Galactic Pole, respectively. We corrected the values for the local standard of rest, where the solar motion is assumed to be (8.50, 13.38, 6.49) km s-1 (Coşkunoǧlu et al. 2011).
We only considered targets with SDSS spectra because of the higher spectral resolution and lower error bars. We fixed the errors on the SDSS vs. 2MASS proper motions to 10 mas/yr and the errors on the RVs to 15 km s-1 for sources with error bars lower than these values. We considered the largest error bars on the distances to be conservative.
Most of the targets exhibit large space motions in nearly all three UVW components, confirming their membership to the thick disk and/or halo. Using the orientative flags defined by Eggen (1990) and Leggett (1992), two of our SDSS subdwarfs are classified as young-old-disk (YOD; Table A.5) although the error bars may locate them within old-disk (OD) category. From the UVW determinations shown in Table A.5, we derive the following average space velocities of ⟨ U ⟩ = 2, ⟨ V ⟩ = −124, ⟨ W ⟩ = −78 km s-1 with velocity dispersions of σU =180, σV = 188, and σW = 109 km s-1. The mean space velocities of our sample are typical of halo stars, where the U component is around null velocity while the velocity in the direction of the Galactic rotation is quite negative, consistent with the numbers reported in Table 7 of Savcheva et al. (2014). We note that our average value of the W component is lower than the one in Savcheva et al. (2014) but the dispersions are quite large and our sample is too small to draw any statistically-significant conclusion. The Galactic velocity dispersions are significantly greater (by factors of 5–8) than those corresponding to solar metallicity stars up to a kiloparsec distance from the Sun (e.g. Fuchs et al. 2009, and references therein). These large dispersions, particularly that of the W component, give credit to the low metallicity nature of our sample as a whole.
Finally, two subdwarfs in our sample with SDSS spectra (ID = 8 and 29) appear to have very high Galactic motions with velocities slightly above ~450 km s-1, which is the accepted escape velocity threshold in the halo (Kenyon et al. 2008; Favia et al. 2015). Whether these stars are runaway candidates is to be confirmed. We caution that a reliable trigonometric parallax and accurate radial velocities need to be measured before concluding that these stars are potentially unbound from the Galaxy gravity. The Gaia mission should provide accurate proper motions and distances for both of them.
6.7. Surface density of subdwarfs
Here we estimate the surface density (i.e. numbers of objects per square degree) of low-metallicity dwarfs with spectral types equal or later than M5 found in the common area of each cross-correlation.
For the SDSS DR7 vs. 2MASS cross-match, we found a total common area of 8826 sq. deg. We confirmed 24 out of 29 objects as late-type subdwarfs: ten subdwarfs (sdM5−sdM8.5; including the dM/sdM source ID = 19), 12 extreme subdwarfs (esdM5−esdM8), and two usdM (usdM6−usdM7.5). Each metallicity subclass represents 42 ± 13%, 50 ± 14%, and 8 ± 6% of our total sample, respectively. These late-type subdwarfs have SDSSr = 17.073−20.535 mag, J = 13.995−16.895 mag, spectral types between M5 and M8.5, and proper motions in the range 0.143−1.872 arcsec/yr. We derive surface densities of 0.0011 ± 0.0004, 0.0014 ± 0.0004, and 0.0002 ± 0.0002 per square degree for subdwarfs, extreme subdwarfs, and ultrasubdwarfs respectively.
For the SDSS DR9 and UKIDSS DR10 cross-match, we confirmed 59 out of 63 candidates as late-type subdwarfs including three L-type dwarfs in 3679 sq. deg. Our sample is divided into 43 subdwarfs (M5−L0.5), 13 extreme subdwarfs (M5−M8), and four ultrasubdwarfs (M5−M6.5). Each metallicity class represents 72 ± 11%, 22 ± 6%, and 7 ± 3% of our sample. These confirmed subdwarfs have SDSSr = 19.6−23.3 mag, J = 15.9−18.8 mag, spectral types between M5 and L0.5, and proper motions of 0.09−0.66 arcsec/yr. We derive a surface density of late-type subdwarfs of 0.016 ± 0.002 per sq. deg, divided up into densities of 0.012 ± 0.002, 0.004 ± 0.001, and 0.001 ± 0.001 per sq. deg for subdwarfs, extreme subdwarfs, and ultrasubdwarfs, respectively.
Following our previous analysis (Lodieu et al. 2012), we consider the photometric sample from Bochanski et al. (2010) for field M5 dwarfs: i < 22 mag, r−z ≥ 2.5 mag, i−z ≥ 0.2 mag, and r−i ≥ 0.3 mag. These criteria give us a total of 653 625 photometric M5 dwarfs and later in 8000 sq. deg surveyed by SDSS DR5, yielding a density of ~82 late-M dwarfs per square degree. This density is ~5100 times higher than the value obtained for late-type subdwarfs. We observe that the density of late-type dwarfs drops with decreasing metallicity. Due to the incompleteness of our survey particularly at the faintest magnitudes and coolest types, the aforementioned surface density are lower limits to the true density of subdwarfs.
In addition, we are aware of potential losses of candidates when the selection involves proper motion and photometric criteria. It is extremely hard to provide an estimate on the losses but we know that percentages can be of the order of 30% in the case of clusters (Barrado y Navascués et al. 2002; Moraux et al. 2003). To give a more reliable estimate of completeness, we compiled a list of 114 known ≥ M5 subdwarfs and attempted to recover them in the latest SDSS and UKIDSS data releases using our criteria detailed in Sect. 2. We found that 45 of these 114 late-type subdwarfs lie in the common area between SDSS and UKIDSS (45 are in UKIDSS and 95 in SDSS). We recovered 18 of these 45 known subdwarfs in the SDSS DR9 vs. UKIDSS LAS DR10 area using the exact same criteria (see Sect. 2), suggesting that our sample is only 40 ± 9% complete. We repeated the same exercise for the 29 candidates in the SDSS DR7 vs. 2MASS cross-correlation, and found six lying in the common area. We recovered one of them, suggesting that our sample is complete at the ~17% level keeping in mind the low number statistics (range of 0–33%).
We looked at the main reasons for this low recovery rate and found the following conclusions:
-
Sixteen of the 45 sources have separations out-side our 1–5 arcsec range, in-cluding 15 with lower separations (Burgasseret al. 2004b; Lépine& Scholz 2008; Lodieuet al. 2010; Schmidtet al. 2010; Kirkpatricket al. 2010; Lodieuet al. 2012; Zhanget al. 2013) and one withhigher (SDSS125637−022452; Sivaraniet al. 2009). This loss representsabout one third of the full sample and more than half of the losses.It also represents the majority of losses in the 2MASS vs. SDSSwith three sources outside our interval. We tested the selection ofobjects with separations in the 0.5–1.0 arcsec butthe numbers of candidates and contaminants increases quickly,making the spectroscopic follow-up more complicated.
-
Two of the 45 sources are not classified as stars or stellar by SDSS (one object with cl = 3) and UKIDSS (one source with mergedClass = 1) surveys (Lodieu et al. 2012; Kirkpatrick et al. 2010).
-
Four of the 45 sources have differences outside our limits for the positional matching in UKIDSS: Xi and Eta between −0.5 and 0.5 for J and K (Lépine & Scholz 2008; Burgasser et al. 2004b; Zhang et al. 2013; Kirkpatrick et al. 2010).
-
Five of the 45 sources are lost due to their colours: one is lost because it has r−i of 0.96 mag, two have g−r colours bluer than 1.8 mag, and two have J−K colours above 0.7 mag (Lodieu et al. 2012; Zhang et al. 2013). In the case of the SDSS vs. 2MASS cross-match, we lose one source because of its J−K colour (sdM5.5).
-
One of the sources in the SDSS vs. 2MASS cross-match has a Hr value below our limit of 20.7 mag (20.64 mag; esdM5.5).
As a consequence, we should revise the aforementioned density of cool subdwarfs per square degree in SDSS and UKIDSS from 0.016 ± 0.002 to 0.040 for the intervals quoted earlier. We do not correct the observed surface density of the 2MASS/SDSS cross-match because of the small number statistics in the recovery rate. The comparison between densities of M dwarfs and late-type subdwarfs is consistent with the upper limit of 0.68% derived from the SDSS M dwarf sample (Covey et al. 2008).
7. Mid-infrared photometry of M subdwarfs
The Wide-field Infrared Survey Explorer (WISE) mapped the sky at 3.4 (W1), 4.6 (W2), 12 (W3), and 22 (W4) μm (WISE9; Wright et al. 2010). We present mid-infrared photometry for our subdwarfs from AllWISE, which combines data from the WISE cryogenic and NEOWISE post-cryogenic survey phases (Mainzer et al. 2011). We cross-matched our sample of subdwarfs with the AllWISE database using a matching radius of 12 arcsec to take into account the large motion of some subdwarfs.
In Fig. 9, we plot several infrared colours as a function of spectral types showing our sample (coloured symbols) on top of the sequence of field M and L dwarfs (black symbols; Kirkpatrick et al. 2010). This field dwarf sample contains 229 M dwarfs out of 536 listed in the DwarfArchives.org website as well as the M0–L8 dwarfs in Kirkpatrick et al. (2011). We included only sources with detections above 3σ and quoted error bars in each WISE passband. We overplotted our confirmed subdwarfs, extreme subdwarfs, and ultrasubdwarfs as red squares, green circles, and blue triangles, respectively.
In Fig. 9, we see that subdwarfs do not appear to differ from those of solar-metallicity dwarfs of similar spectral types in J−W3 and W2−W3 colours. They appear slightly bluer in W1−W2 and H−W2 towards later spectral types, the latter being the most noticeable. The same trend becomes more obvious in the diagrams depicting the J−W1 and J−W2 colours, especially for metal-poor dwarfs with spectral types later than M7 that appear bluer than their solar-abundance counterparts.
We observe that one source, ID = 14 (sdM7.0), lies above the sequence in most diagrams (Fig. 9). In particular, its W2−W3 and J−W3 colour appear significantly redder than the sequence of M and L dwarfs. However, this should be treated with caution because its mid-infrared photometry might be contaminated by the presence of a close object at the spatial resolution of WISE.
We checked the WISE images of all our subdwarfs. We confirmed that only one of them (ID = 14) is detected in the W3 and W4 bands and has a W3−W4 colour of 1.9 ± 0.4 mag. Among all M dwarfs in the DwarfsArchive.org website, no M7.5 dwarf has AllWISE photometry with W3 and W4 detections with signal-to-noise higher than 3 (snr > 3). However, the mean W3−W4 colour solar-metallicity M dwarfs independent of their spectral types is 0.10 ± 0.05 mag (considering M dwarfs with snr> 3 in both filters). Our subdwarf is about two magnitudes redder in W3−W4 and deviates from the mean by more than 5σ. Although this fact is based only on one late-M dwarf whose mid-infrared photometry might be contaminated by the presence of a nearby source at the resolution of WISE, we might further investigate the role of metallicity between 10 and 20 μm either photometrically or spectroscopically.
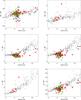 |
Fig. 9 Infrared colours of subdwarfs as a function of spectral types (increasing spectral types to the right, where 0 ≡ M0 and 10 ≡ L0). We plot new and known subdwarfs, extreme subdwarfs, and ultrasubdwarfs as red squares, green circles, and blue triangles respectively. Small black diamonds are solar-metallicity M dwarfs from the DwarfArchives.org website with their AllWISE photometry, as well as M and L dwarfs from Kirkpatrick et al. (2011) with their WISE photometry. We highlighted as cyan stars field L dwarfs with features of L subdwarfs (Sect. 7). |
We would like to add a special note here: in Espinoza Contreras et al. (2013), we showed these diagrams without imposing a constraint on the S/N in the WISE bands considering only subdwarfs from this paper, from Lodieu et al. (2012), and Lépine & Scholz (2008). However, if we include only objects with snr > 3, two objects pop up: ID = 14 with W2−W3 = 2.2 mag and ID = 16 with W2−W3 = 4.0 mag (Lodieu et al. 2012). However, ID = 16 does not have an error associated to its W3 magnitude so we removed it from the revised version of the W2−W3 vs. spectral type diagram displayed in the top right panel of Fig. 9.
In Figs. 9 and 10 we highlighted six objects that deviate from the main sequence of L dwarfs (cyan star symbols). All come from the sample of Kirkpatrick et al. (2011) and appear bluer than field L dwarfs. We found that these six objects have public spectra in the SpeX archive. We compare them to low-resolution spectra of known subdwarfs with similar spectral types to clarify their nature. We see that WISEP J103322.01+400547.8, classified as a L6 in the near-infrared by Kirkpatrick et al. (2011) looks like a normal mid-L dwarf. The other two objects, WISEP J142227.23+221558.3 and WISEP J102552.58+321231.5, classified in the near-infrared as L6.5:: and L7.5::, respectively (Kirkpatrick et al. 2011) show low-metallicity features, in particular stronger FeH lines and absence of the CO band around 2.3 μm. Thus, we argue that both are bona-fide metal-poor L dwarfs. We also checked the SDSS spectroscopic database and found optical spectra for WISEP J144938.12+235536.3 (L0) and WISEP J141011.08+132900.8 (L4). Both appear to exhibit some features typical of L subdwarfs in the optical, but higher signal-to-noise spectra over a wider wavelength range are needed to fully assess their nature. We are not able to check the metal-poor nature of the remaining object (WISEP J143535.75-004347.4) classified as a L3. The blue nature of the J−W1 and J−W2 colours can be explained by the onset of collision-induced H2 opacity operating at near-infrared wavelengths, typically beyond 2 μm. The collision-induced absorption is dependent on temperature and surface gravity (Saumon et al. 1994) and dominates the opacities at high density and low temperatures (Lenzuni et al. 1991). We propose that the J−W1 and J−W2 colours could be used to define new criteria to find cooler late-type subdwarfs in near- and mid-infrared surveys.
 |
Fig. 10 New and known M dwarfs and subdwarfs with different metallicity classes with the same symbology as in Fig. 9. We added field L dwarfs as small orange diamonds and known L subdwarfs with AllWISE photometry as filled magenta squares with their spectral type. |
8. Conclusions
We have demonstrated that cross-correlations between optical and near-infrared large-scale surveys represent a very powerful tool to identify cool subdwarfs. Combining this study with Lodieu et al. (2012), we have increased the number of late-type subdwarfs by a factor of two and confirmed spectroscopically four new L subdwarfs. In this work, we report 68 new metal-poor M dwarfs, divided up into 36 subdwarfs, 26 extreme subdwarfs, and six ultrasubdwarfs, to which we should add two L subdwarfs and two dM/sdM, Our photometric and astrometric search shows success rates beyond the 80% mark. The spectrophotometric distances of our new late-type subdwarfs range from 50 to ~500 pc for subdwarfs and extreme subdwarfs. We inferred a surface density for M-type subdwarfs of 0.033–0.052 per sq. deg in the SDSS/UKIDSS cross-match in the J = 15.9–18.8 mag range after correcting for incompleteness.
We also note that the proper motions calculated by the catalogue positions and epochs can sometimes be erroneous. It is therefore necessary to check these proper motions and improve them to further optimise photometric and proper motion searches.
We searched for wide companions of early spectral types to our subdwarfs in different catalogues using our refined proper motions for those in SDSS vs. UKIDSS and the PPMXL proper motions for those in 2MASS and SDSS. We found one potential bright companion in the Hipparcos-Tycho catalogue based on proper motion and spectroscopic distance. However the lack of metallicity estimate does not lead to a strong conclusion.
We also cross-matched our sample of new late-type subdwarfs as well as known subdwarfs with the AllWISE database to investigate the role of metallicity in the mid-infrared. We conclude that subdwarfs with spectral types later than M7 appear bluer than their solar-abundance counterparts in the J−W1 and J−W2 colours, most likely due to the onset of the collision-induced H2 opacity beyond 2 μm. We suggest this as new colour criteria to look for ultracool subdwarfs in the future.
The main objective of this large project is to increase the number of metal-poor dwarfs, determine the space density of metal-poor dwarfs, improve the current classification of M subdwarfs, and expand it to the L subdwarfs (and later T) regime. We are now able to optimise our photometric and proper motion criteria and apply them to future searches in new data releases of optical, near-infrared, and mid-infrared large-scale surveys. This will allow us to increase the census of metal-poor dwarfs, especially at the coolest temperatures and lowest metallicities.
IRAF is distributed by the National Optical Astronomy Observatories, which are operated by the Association of Universities for Research in Astronomy, Inc., under cooperative agreement with the National Science Foundation.
Acknowledgments
N.L. and M.E.C. were funded by the Ramón y Cajal fellowship number 08-303-01-02, and supported by the grants numbers AYA2010-19136 and AYA2015-69350-C3-2-P from Spanish Ministry of Economy and Competitiveness (MINECO). E.L.M. is supported by the MINECO grant number AYA2015-69350-C3-1-P. The data presented here were obtained [in part] with ALFOSC, which is provided by the Instituto de Astrofisica de Andalucia (IAA) under a joint agreement with the University of Copenhagen and NOTSA. Funding for the SDSS and SDSS-II has been provided by the Alfred P. Sloan Foundation, the Participating Institutions, the National Science Foundation, the US Department of Energy, the National Aeronautics and Space Administration, the Japanese Monbukagakusho, the Max Planck Society, and the Higher Education Funding Council for England. The SDSS Web Site is http://www.sdss.org/. The SDSS is managed by the Astrophysical Research Consortium for the Participating Institutions. The Participating Institutions are the American Museum of Natural History, Astrophysical Institute Potsdam, University of Basel, University of Cambridge, Case Western Reserve University, University of Chicago, Drexel University, Fermilab, the Institute for Advanced Study, the Japan Participation Group, Johns Hopkins University, the Joint Institute for Nuclear Astrophysics, the Kavli Institute for Particle Astrophysics and Cosmology, the Korean Scientist Group, the Chinese Academy of Sciences (LAMOST), Los Alamos National Laboratory, the Max-Planck-Institute for Astronomy (MPIA), the Max-Planck-Institute for Astrophysics (MPA), New Mexico State University, Ohio State University, University of Pittsburgh, University of Portsmouth, Princeton University, the United States Naval Observatory, and the University of Washington. This publication makes use of data products from the Two Micron All Sky Survey, which is a joint project of the University of Massachusetts and the Infrared Processing and Analysis Center/California Institute of Technology, funded by the National Aeronautics and Space Administration and the National Science Foundation. The UKIDSS project is defined in Lawrence et al. (2007). UKIDSS uses the UKIRT Wide Field Camera Casali et al. (WFCAM; 2007). The photometric system is described in Hewett et al. (2006), and the calibration is described in Hodgkin et al. (2009). The pipeline processing and science archive are described in Irwin et al. (in prep.) and Hambly et al. (2008). This research has made use of the Spanish Virtual Observatory (svo.cab.inta-csic.es) supported from the Spanish MICINN/MINECO through grants AyA2008-02156, AyA2011-24052. This research has benefitted from the M, L, T, and Y dwarf compendium housed at DwarfArchives.org. This research has benefitted from the SpeX Prism Spectral Libraries, maintained by Adam Burgasser at http://pono.ucsd.edu/~adam/browndwarfs/spexprism. This research has made use of data obtained from the SuperCOSMOS Science Archive, prepared and hosted by the Wide Field Astronomy Unit, Institute for Astronomy, University of Edinburgh, which is funded by the UK Science and Technology Facilities Council.
References
- Appenzeller, I., Fricke, K., Fürtig, W., et al. 1998, The Messenger, 94, 1 [NASA ADS] [Google Scholar]
- Baraffe, I., Chabrier, G., Allard, F., & Hauschildt, P. H. 1997, A&A, 327, 1054 [NASA ADS] [Google Scholar]
- Barrado y Navascués, D., Bouvier, J., Stauffer, J. R., Lodieu, N., & McCaughrean, M. J. 2002, A&A, 395, 813 [NASA ADS] [CrossRef] [EDP Sciences] [Google Scholar]
- Bochanski, J. J., Hawley, S. L., Covey, K. R., et al. 2010, AJ, 139, 2679 [NASA ADS] [CrossRef] [Google Scholar]
- Bonnarel, F., Fernique, P., Bienaymé, O., et al. 2000, A&AS, 143, 33 [NASA ADS] [CrossRef] [EDP Sciences] [Google Scholar]
- Bowler, B. P., Liu, M. C., & Dupuy, T. J. 2010, ApJ, 710, 45 [NASA ADS] [CrossRef] [Google Scholar]
- Burgasser, A. J. 2004, ApJ, 614, L73 [NASA ADS] [CrossRef] [Google Scholar]
- Burgasser, A. J., Kirkpatrick, J. D., Burrows, A., et al. 2003, ApJ, 592, 1186 [NASA ADS] [CrossRef] [Google Scholar]
- Burgasser, A. J., Kirkpatrick, J. D., McGovern, M. R., et al. 2004a, ApJ, 604, 827 [NASA ADS] [CrossRef] [Google Scholar]
- Burgasser, A. J., McElwain, M. W., Kirkpatrick, J. D., et al. 2004b, AJ, 127, 2856 [NASA ADS] [CrossRef] [Google Scholar]
- Burgasser, A. J., Cruz, K. L., & Kirkpatrick, J. D. 2007, ApJ, 657, 494 [NASA ADS] [CrossRef] [Google Scholar]
- Burgasser, A. J., Vrba, F. J., Lépine, S., et al. 2008, ApJ, 672, 1159 [NASA ADS] [CrossRef] [Google Scholar]
- Burgasser, A. J., Witte, S., Helling, C., et al. 2009, ApJ, 697, 148 [NASA ADS] [CrossRef] [Google Scholar]
- Casali, M., Adamson, A., Alves de Oliveira, C., et al. 2007, A&A, 467, 777 [NASA ADS] [CrossRef] [EDP Sciences] [Google Scholar]
- Cepa, J., Aguiar, M., Escalera, V. G., et al. 2000, in SPIE Conf. Ser. 4008, eds. M. Iye, & A. F. Moorwood, 623 [Google Scholar]
- Coşkunoǧlu, B., Ak, S., Bilir, S., et al. 2011, MNRAS, 412, 1237 [NASA ADS] [Google Scholar]
- Covey, K. R., Ivezić, Ž., Schlegel, D., et al. 2007, AJ, 134, 2398 [NASA ADS] [CrossRef] [Google Scholar]
- Covey, K. R., Hawley, S. L., Bochanski, J. J., et al. 2008, AJ, 136, 1778 [NASA ADS] [CrossRef] [Google Scholar]
- Cushing, M. C., Looper, D., Burgasser, A. J., et al. 2009, ApJ, 696, 986 [NASA ADS] [CrossRef] [Google Scholar]
- Cutri, R. M., Skrutskie, M. F., van Dyk, S., et al. 2003, VizieR On-line Data Catalog: II/246 [Google Scholar]
- Eggen, O. J. 1990, AJ, 100, 1159 [NASA ADS] [CrossRef] [Google Scholar]
- Espinoza Contreras, M., Lodieu, N., Zapatero Osorio, M. R., et al. 2013, Mem. Soc. Astron. It., 84, 963 [NASA ADS] [Google Scholar]
- Evans, N. W. 1992, MNRAS, 258, 587 [NASA ADS] [Google Scholar]
- Favia, A., West, A. A., & Theissen, C. A. 2015, ApJ, 813, 26 [NASA ADS] [CrossRef] [Google Scholar]
- Fuchs, B., Dettbarn, C., Rix, H.-W., et al. 2009, AJ, 137, 4149 [NASA ADS] [CrossRef] [Google Scholar]
- Gizis, J. E. 1997, AJ, 113, 806 [NASA ADS] [CrossRef] [Google Scholar]
- Gizis, J. E., & Reid, I. N. 1997, PASP, 109, 849 [NASA ADS] [CrossRef] [Google Scholar]
- Gliese, W., & Jahreiss, H. 1995, VizieR On-line Data Catalog: V/70 [Google Scholar]
- Hambly, N. C., Davenhall, A. C., Irwin, M. J., & MacGillivray, H. T. 2001a, MNRAS, 326, 1315 [NASA ADS] [CrossRef] [Google Scholar]
- Hambly, N. C., Irwin, M. J., & MacGillivray, H. T. 2001b, MNRAS, 326, 1295 [Google Scholar]
- Hambly, N. C., MacGillivray, H. T., Read, M. A., et al. 2001c, MNRAS, 326, 1279 [NASA ADS] [CrossRef] [Google Scholar]
- Hambly, N. C., Collins, R. S., Cross, N. J. G., et al. 2008, MNRAS, 384, 637 [NASA ADS] [CrossRef] [Google Scholar]
- Hawley, S. L., Covey, K. R., Knapp, G. R., et al. 2002, AJ, 123, 3409 [NASA ADS] [CrossRef] [Google Scholar]
- Hewett, P. C., Warren, S. J., Leggett, S. K., & Hodgkin, S. T. 2006, MNRAS, 367, 454 [NASA ADS] [CrossRef] [Google Scholar]
- Hodgkin, S. T., Irwin, M. J., Hewett, P. C., & Warren, S. J. 2009, MNRAS, 394, 675 [NASA ADS] [CrossRef] [Google Scholar]
- Jao, W.-C., Henry, T. J., Beaulieu, T. D., & Subasavage, J. P. 2008, AJ, 136, 840 [NASA ADS] [CrossRef] [Google Scholar]
- Johnson, D. R. H., & Soderblom, D. R. 1987, AJ, 93, 864 [NASA ADS] [CrossRef] [Google Scholar]
- Jones, E. M. 1972, ApJ, 177, 245 [NASA ADS] [CrossRef] [Google Scholar]
- Kenyon, S. J., Bromley, B. C., Geller, M. J., & Brown, W. R. 2008, ApJ, 680, 312 [NASA ADS] [CrossRef] [Google Scholar]
- Kirkpatrick, J. D., Looper, D. L., Burgasser, A. J., et al. 2010, ApJS, 190, 100 [NASA ADS] [CrossRef] [Google Scholar]
- Kirkpatrick, J. D., Cushing, M. C., Gelino, C. R., et al. 2011, ApJS, 197, 19 [NASA ADS] [CrossRef] [Google Scholar]
- Laird, J. B., Carney, B. W., Rupen, M. P., & Latham, D. W. 1988, AJ, 96, 1908 [NASA ADS] [CrossRef] [Google Scholar]
- Lawrence, A., Warren, S. J., Almaini, O., et al. 2007, MNRAS, 379, 1599 [NASA ADS] [CrossRef] [MathSciNet] [Google Scholar]
- Leggett, S. K. 1992, ApJS, 82, 351 [NASA ADS] [CrossRef] [Google Scholar]
- Lenzuni, P., Chernoff, D. F., & Salpeter, E. E. 1991, ApJS, 76, 759 [NASA ADS] [CrossRef] [Google Scholar]
- Lépine, S., & Shara, M. M. 2005, AJ, 129, 1483 [NASA ADS] [CrossRef] [Google Scholar]
- Lépine, S., & Scholz, R.-D. 2008, ApJ, 681, L33 [NASA ADS] [CrossRef] [Google Scholar]
- Lépine, S., Shara, M. M., & Rich, R. M. 2002, AJ, 124, 1190 [NASA ADS] [CrossRef] [Google Scholar]
- Lépine, S., Shara, M. M., & Rich, R. M. 2003a, ApJ, 585, L69 [NASA ADS] [CrossRef] [Google Scholar]
- Lépine, S., Rich, R. M., & Shara, M. M. 2003b, ApJ, 591, L49 [NASA ADS] [CrossRef] [Google Scholar]
- Lépine, S., Rich, R. M., & Shara, M. M. 2003c, AJ, 125, 1598 [NASA ADS] [CrossRef] [Google Scholar]
- Lépine, S., Shara, M. M., & Rich, R. M. 2003d, AJ, 126, 921 [NASA ADS] [CrossRef] [Google Scholar]
- Lépine, S., Rich, R. M., & Shara, M. M. 2007, ApJ, 669, 1235 [NASA ADS] [CrossRef] [Google Scholar]
- Lodieu, N., Scholz, R.-D., McCaughrean, M. J., et al. 2005, A&A, 440, 1061 [NASA ADS] [CrossRef] [EDP Sciences] [Google Scholar]
- Lodieu, N., Zapatero Osorio, M. R., & Martín, E. L. 2009, A&A, 499, 729 [NASA ADS] [CrossRef] [EDP Sciences] [Google Scholar]
- Lodieu, N., Zapatero Osorio, M. R., Martín, E. L., Solano, E., & Aberasturi, M. 2010, ApJ, 708, L107 [NASA ADS] [CrossRef] [Google Scholar]
- Lodieu, N., Espinoza Contreras, M., Zapatero Osorio, M. R., et al. 2012, A&A, 542, A105 [NASA ADS] [CrossRef] [EDP Sciences] [Google Scholar]
- Lodieu, N., Burgasser, A. J., Pavlenko, Y., & Rebolo, R. 2015, A&A, 579, A58 [NASA ADS] [CrossRef] [EDP Sciences] [Google Scholar]
- Luyten, W. J. 1979, LHS catalogue. A catalogue of stars with proper motions exceeding 0"5 annually, 2nd edn. (Minneapolis: University of Minnesota) [Google Scholar]
- Luyten, W. J. 1980, NLTT catalogue, Vol. 3: 0 deg. to –10 deg. (Minneapolis: University of Minnesota) [Google Scholar]
- Mainzer, A., Cushing, M. C., Skrutskie, M., et al. 2011, ApJ, 726, 30 [Google Scholar]
- Moraux, E., Bouvier, J., Stauffer, J. R., & Cuillandre, J.-C. 2003, A&A, 400, 891 [NASA ADS] [CrossRef] [EDP Sciences] [Google Scholar]
- Morgan, W. W., Keenan, P. C., & Kellman, E. 1943, in An atlas of stellar spectra, with an outline of spectral classification (Chicago, Ill: The University of Chicago Press) [Google Scholar]
- Rayner, J. T., Toomey, D. W., Onaka, P. M., et al. 2003, PASP, 115, 362 [NASA ADS] [CrossRef] [Google Scholar]
- Riaz, B., Gizis, J. E., & Samaddar, D. 2008, ApJ, 672, 1153 [NASA ADS] [CrossRef] [Google Scholar]
- Roeser, S., Demleitner, M., & Schilbach, E. 2010, AJ, 139, 2440 [NASA ADS] [CrossRef] [Google Scholar]
- Salim, S., & Gould, A. 2002, ApJ, 575, L83 [NASA ADS] [CrossRef] [Google Scholar]
- Salim, S., & Gould, A. 2003, ApJ, 582, 1011 [NASA ADS] [CrossRef] [Google Scholar]
- Saumon, D., Bergeron, P., Lunine, J. I., Hubbard, W. B., & Burrows, A. 1994, ApJ, 424, 333 [NASA ADS] [CrossRef] [Google Scholar]
- Savcheva, A. S., West, A. A., & Bochanski, J. J. 2014, ApJ, 794, 145 [NASA ADS] [CrossRef] [Google Scholar]
- Schilbach, E., Röser, S., & Scholz, R. 2009, A&A, 493, L27 [NASA ADS] [CrossRef] [EDP Sciences] [Google Scholar]
- Schmidt, S. J., West, A. A., Burgasser, A. J., Bochanski, J. J., & Hawley, S. L. 2010, AJ, 139, 1045 [NASA ADS] [CrossRef] [Google Scholar]
- Scholz, R.-D., Irwin, M., Ibata, R., Jahreiß, H., & Malkov, O. Y. 2000, A&A, 353, 958 [NASA ADS] [Google Scholar]
- Scholz, R., Lehmann, I., Matute, I., & Zinnecker, H. 2004a, A&A, 425, 519 [NASA ADS] [CrossRef] [EDP Sciences] [Google Scholar]
- Scholz, R.-D., Lodieu, N., & McCaughrean, M. J. 2004b, A&A, 428, L25 [NASA ADS] [CrossRef] [EDP Sciences] [Google Scholar]
- Schweitzer, A., Scholz, R.-D., Stauffer, J., Irwin, M., & McCaughrean, M. J. 1999, A&A, 350, L62 [NASA ADS] [Google Scholar]
- Sivarani, T., Lépine, S., Kembhavi, A. K., & Gupchup, J. 2009, ApJ, 694, L140 [NASA ADS] [CrossRef] [Google Scholar]
- Skrutskie, M. F., Cutri, R. M., Stiening, R., et al. 2006, AJ, 131, 1163 [NASA ADS] [CrossRef] [Google Scholar]
- Taylor, M. B. 2005, in Astronomical Data Analysis Software and Systems XIV, eds. P. Shopbell, M. Britton, & R. Ebert, ASP Conf. Ser., 347, 29 [Google Scholar]
- Taylor, M. B. 2006, in Astronomical Data Analysis Software and Systems XV, eds. C. Gabriel, C. Arviset, D. Ponz, & S. Enrique, ASP Conf. Ser., 351, 666 [Google Scholar]
- Tody, D. 1986, in SPIE Conf. Ser. 627, ed. D. L. Crawford, 627, 733 [Google Scholar]
- Tody, D. 1993, in Astronomical Data Analysis Software and Systems II, eds. R. J. Hanisch, R. J. V. Brissenden, & J. Barnes, ASP Conf. Ser., 52, 173 [Google Scholar]
- van Altena, W. F., Lee, J. T., & Hoffleit, E. D. 1995, in The general catalogue of trigonometric [stellar] parallaxes (New Haven, CT: Yale university Observatory) [Google Scholar]
- van Leeuwen, F. 2007, A&A, 474, 653 [NASA ADS] [CrossRef] [EDP Sciences] [Google Scholar]
- West, A. A., Walkowicz, L. M., & Hawley, S. L. 2005, PASP, 117, 706 [NASA ADS] [CrossRef] [Google Scholar]
- West, A. A., Hawley, S. L., Bochanski, J. J., et al. 2008, AJ, 135, 785 [NASA ADS] [CrossRef] [Google Scholar]
- Woolf, V. M., Lépine, S., & Wallerstein, G. 2009, PASP, 121, 117 [NASA ADS] [CrossRef] [Google Scholar]
- Wright, E. L., Eisenhardt, P. R. M., Mainzer, A. K., et al. 2010, AJ, 140, 1868 [NASA ADS] [CrossRef] [Google Scholar]
- York, D. G., Adelman, J., Anderson, J. E., et al. 2000, AJ, 120, 1579 [Google Scholar]
- Zapatero Osorio, M. R., & Martín, E. L. 2004, A&A, 419, 167 [NASA ADS] [CrossRef] [EDP Sciences] [Google Scholar]
- Zhang, Z. H., Pinfield, D. J., Burningham, B., et al. 2013, MNRAS, 434, 1005 [NASA ADS] [CrossRef] [Google Scholar]
Appendix A: Additional tables
Candidates with their SDSS coordinates (in J2000), magnitudes, proper motions, and reduced proper motions.
Proper motions and reduced proper motions (Hr) values for our candidates from the VO and refined using SDSS and UKIDSS images.
Logs of observations for our candidates, including telescopes, instruments, total exposure times, mean airmass, and seeing.
Identifier (ID), spectral indices, spectral types, telescope, distances, heliocentric velocities, and space motions for our candidates.
Identifier (ID), spectral indices, spectral types, telescope, distances, heliocentric velocities, and space motions for our candidates.
Appendix B: The SVO subdwarf archive
In order to help the astronomical community use the catalogue of subdwarfs used in this paper, we have developed an archive system that can be accessed from a webpage10 or through a Virtual Observatory ConeSearch11. We decided to include in the archive not only the subdwarfs reported in the paper (100) but all known ultracool subdwarfs with spectral types later than M5 from the literature (202).
Appendix B.1: Web access
The archive system implements a very simple search interface that permits queries by coordinates/radius and/or range of magnitudes, colours and effective temperatures. The default search radius is set to 5 arcsec. The user can also select the maximum number of sources to return (with values ranging from ten to unlimited) (Fig. B.1).
The result of the query is a HTML table with all the sources found in the archive fulfilling the search criteria. Detailed information on the output fields can be obtained placing the mouse over the question mark (“?”) located close to the name of the column. The system returns the coordinates, both in decimal and sexagesimal degrees, the object identifier, the spectral type, direct access to the spectra (in fits and ascii formats), the temperature obtained from VOSA12 as well a visualization of the SED fitting by just cliking on the Teff value, and the SDSS, 2MASS, UKIDSS (LAS and GCS surveys), VISTA Hemisphere Survey (VHS) and WISE magnitudes. The system also includes a link to the finderchart capability developed at IRSA13.
The archive implements the SAMP14 (Simple Application Messaging Protocol). SAMP allows applications to communicate with each other in a seamless and transparent way for the user. This way, the results of a query can be easily transferred to other VO applications, such as, for instance, Topcat (Fig. B.2).
 |
Fig. B.1 Screenshot of the archive search interface that permits simple queries. |
 |
Fig. B.2 Screenshot of the typical window returned after a query. |
Appendix B.2: Virtual Observatory access
The Virtual Observatory (VO)15 is an international initiative whose primary goal is to provide an efficient access and analysis of the information hosted in astronomical archives and services. Having a VO-compliant archive is an important added value for an astronomical project to guarantee the optimum scientific exploitation of their datasets.
Our archive system has been designed following the IVOA standards and requirements. In particular, it implements the Cone Search protocol, a standard defined for retrieving records from a catalogue of astronomical sources. The query made through the Cone Search service describes a sky position and an angular distance, defining a cone on the sky. The response returns a list of astronomical sources from the catalogue whose positions lie within the cone, formatted as a VOTable.
All Tables
Candidates with their SDSS coordinates (in J2000), magnitudes, proper motions, and reduced proper motions.
Proper motions and reduced proper motions (Hr) values for our candidates from the VO and refined using SDSS and UKIDSS images.
Logs of observations for our candidates, including telescopes, instruments, total exposure times, mean airmass, and seeing.
Identifier (ID), spectral indices, spectral types, telescope, distances, heliocentric velocities, and space motions for our candidates.
Identifier (ID), spectral indices, spectral types, telescope, distances, heliocentric velocities, and space motions for our candidates.
All Figures
|
Fig. 1 (i−J vs. J−K) colour–colour diagram for candidates with optical spectra. Symbols are as follows: sdM/L (filled red squares), esdM (filled green circles), usdM (filled blue triangles), candidates with uncertain class (filled black upside down triangles), and solar-metallicity M dwarfs (filled black diamonds). The empty five pointed stars represent the 14 candidates without optical spectroscopy yet. We also included a few known subdwarfs, extreme subdwarfs, and ultrasubdwarfs published in the literature (empty symbols). The empty diamonds joined with a continuum line in the right part of the diagram are solar-metallicity M dwarfs from West et al. (2008). The J and K magnitudes of candidates with ID = 1–29 are in the UKIDSS Vega system (Hewett et al. 2006), except for objects with ID = 1, 2, 6, 10, 11, and 19, which are plotted with their original 2MASS photometry. |
| In the text | |
|
Fig. 2 Reduced proper motion diagram of new subdwarfs and solar-metallicity M dwarfs. Hr was computed using the proper motions obtained from the positions and epochs of the cross-matched catalogues. Same symbology as Fig. 1 for our candidates. Small grey dots correspond to objects from Lépine’s catalogue with SDSS photometry Lépine & Shara (2005). |
| In the text | |
|
Fig. 3 Improved GTC OSIRIS low-resolution optical spectrum of ULAS J13505886+0815068. The spectrum of the known sdL4 2MASS J16262035+3925190 from Burgasser (2004), Burgasser et al. (2007) is overplotted. |
| In the text | |
|
Fig. 4 Low-resolution optical spectra for 38 candidates confirmed as M and L subdwarfs (black) with their identifier (ID) and telescope name. Overplotted in red are subdwarf spectral templates from SDSS used to assign the final spectral types (see Sect. 5.2). Candidates with ID = 1, 8, and 83 appear twice, because they have spectra from our own follow-up and from the SDSS spectroscopic database. |
| In the text | |
|
Fig. 5 Low-resolution optical spectra for our candidates (black) with identifier (ID) and telescope name. Overplotted in red, green, and blue are the spectral templates of SDSS dwarfs/subdwarfs used to assign the final spectral types (see Sect. 5.2 and legend on the plot). First and second columns: 26 candidates confirmed as extreme subdwarfs. Third column, lower part: six candidates confirmed as ultrasubdwarfs. Third column, upper part: five candidates classified as dM and two candidates with uncertain class, between dM and sdM. Candidates with IDs 5, 9, 11, 15, and 7 appear twice because they were included in our spectroscopic follow-up and have a spectrum in the SDSS spectroscopic database. |
| In the text | |
|
Fig. 6 Distribution of subdwarfs as a function of their spectral indices. Symbols are as in Fig. 1. The bottom right plot shows the CaH2+CaH3 vs. TiO5 diagram for objects classified as sdM, esdM, or usdM (small diamonds in red, green, and blue, respectively) in the SDSS spectroscopic database. Plots originally presented in Gizis (1997) and Lépine et al. (2007), updated with our discoveries. |
| In the text | |
|
Fig. 7 Spectral indices (CaH1, CaH2, CaH3, and TiO5) vs. the final spectral types for our subdwarfs, extreme subdwarfs, ultrasubdwarfs, and solar-metallicity dwarfs plotted as filled squares, circles, triangles, and diamonds respectively. |
| In the text | |
|
Fig. 8 Spectral types based on spectral templates and the spectral types derived from the indices defined by Lépine et al. (2007). We used the same symbology as in Fig. 1. We observe a trend where spectral templates lead to later spectral types compared to the classification based on spectral indices. We also highlighted confirmed metal-poor dwarfs with discrepant classes (not only spectral types) derived from both systems (asterisks). |
| In the text | |
|
Fig. 9 Infrared colours of subdwarfs as a function of spectral types (increasing spectral types to the right, where 0 ≡ M0 and 10 ≡ L0). We plot new and known subdwarfs, extreme subdwarfs, and ultrasubdwarfs as red squares, green circles, and blue triangles respectively. Small black diamonds are solar-metallicity M dwarfs from the DwarfArchives.org website with their AllWISE photometry, as well as M and L dwarfs from Kirkpatrick et al. (2011) with their WISE photometry. We highlighted as cyan stars field L dwarfs with features of L subdwarfs (Sect. 7). |
| In the text | |
|
Fig. 10 New and known M dwarfs and subdwarfs with different metallicity classes with the same symbology as in Fig. 9. We added field L dwarfs as small orange diamonds and known L subdwarfs with AllWISE photometry as filled magenta squares with their spectral type. |
| In the text | |
|
Fig. B.1 Screenshot of the archive search interface that permits simple queries. |
| In the text | |
|
Fig. B.2 Screenshot of the typical window returned after a query. |
| In the text | |
Current usage metrics show cumulative count of Article Views (full-text article views including HTML views, PDF and ePub downloads, according to the available data) and Abstracts Views on Vision4Press platform.
Data correspond to usage on the plateform after 2015. The current usage metrics is available 48-96 hours after online publication and is updated daily on week days.
Initial download of the metrics may take a while.