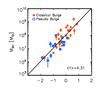
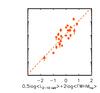
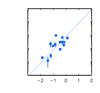
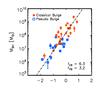
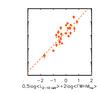
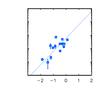
Fig. 2

Virial relations between the BH mass MBH = f × Mvir and the average VP given by the mean FWHM (once the Hβ has been converted into Hα) and the mean L2−10 keV (using Eq. (4) to convert L14−195 keV). In the top panels the black hole masses have been calculated assuming ⟨ f ⟩ = 4.31 (Grier et al. 2013), while in the bottom panels two different f factors, fCB = 6.3 for classical bulges and fPB = 3.2 for pseudo-bulges (Ho & Kim 2014), have been adopted to determine MBH. All the VPs are normalized as specified in Eq. (2) (see Tables 3, 4 for the resulting best-fit parameters). In the left panels the total calibrating sample is shown, while in the middle and right panels the sub-samples of classical (red filled squares) and pseudo-bulges (blue open squares) are shown separately. The lines show the best-fitting virial relations derived for each sample.
Current usage metrics show cumulative count of Article Views (full-text article views including HTML views, PDF and ePub downloads, according to the available data) and Abstracts Views on Vision4Press platform.
Data correspond to usage on the plateform after 2015. The current usage metrics is available 48-96 hours after online publication and is updated daily on week days.
Initial download of the metrics may take a while.