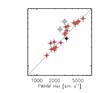
Fig. 1
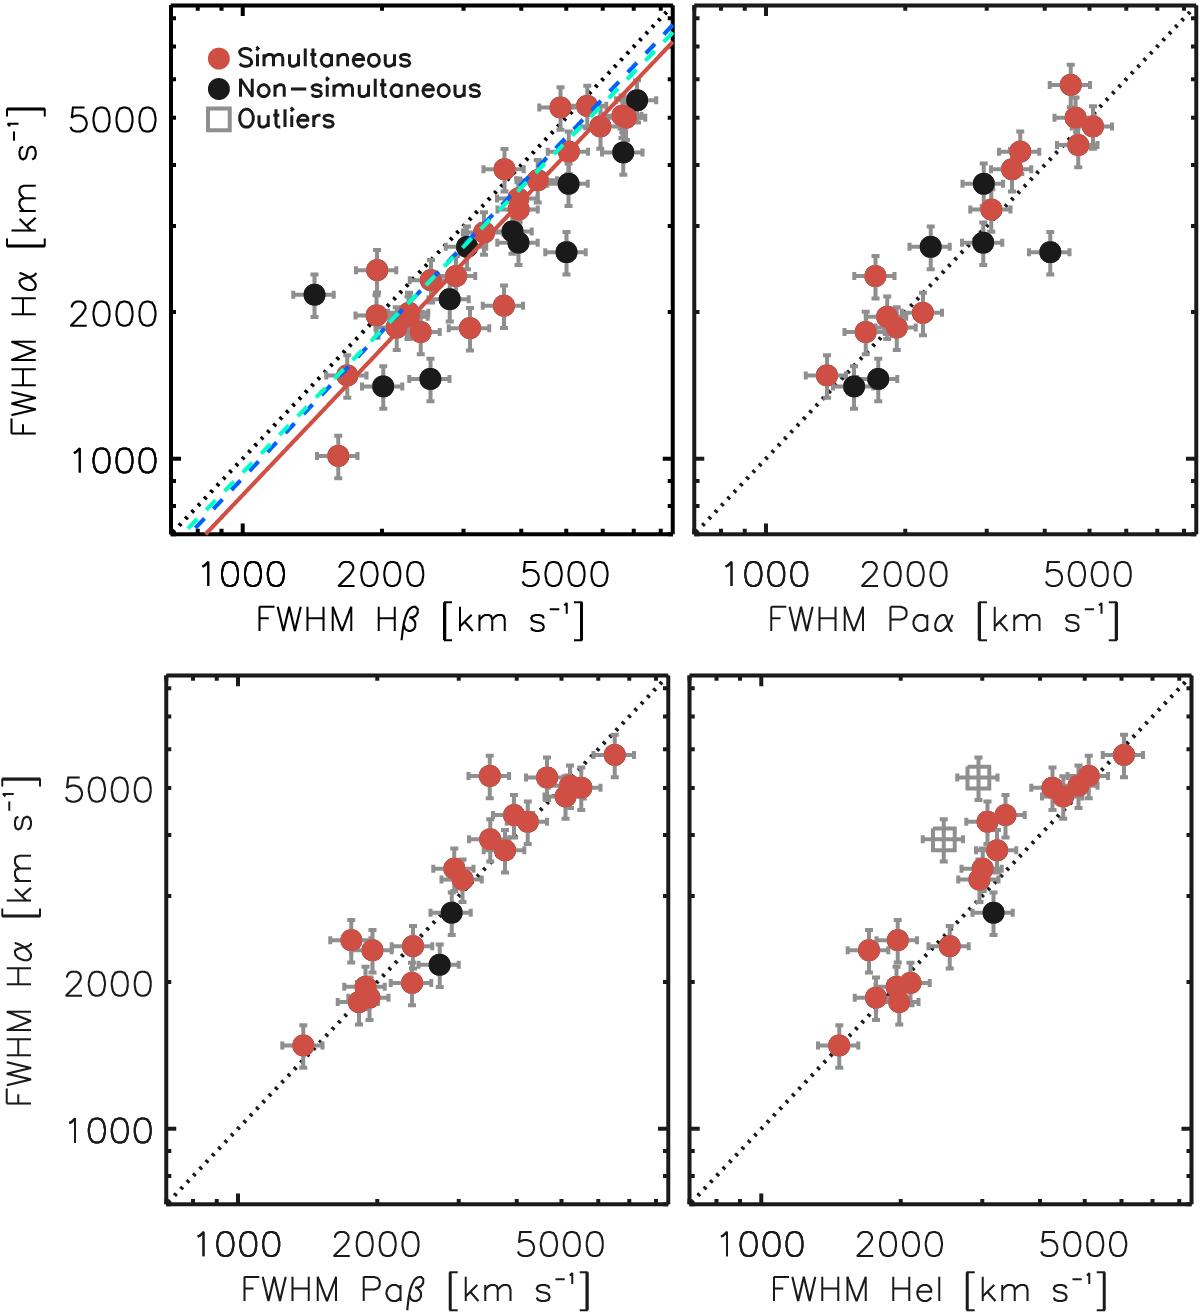
Linear relations between the FWHM of Hα and the FWHM of Hβ, Paα, Paβ, or He i, from left to right and top to bottom. Red filled circles denote simultaneous observations of the two lines, while black filled circles describe non-simultaneous line measurements. Grey open squares indicate the measurements that are classified as outliers (see text for more details) and are not considered in the fits. The black dotted line shows the 1:1 relation in all panels. In the top left panel, the best-fit relation computed on the coeval sample is shown as a red solid line. The relations from Greene & Ho (2005, dashed cyan) and Mejía-Restrepo et al. (2016, dashed blue) are also reported.
Current usage metrics show cumulative count of Article Views (full-text article views including HTML views, PDF and ePub downloads, according to the available data) and Abstracts Views on Vision4Press platform.
Data correspond to usage on the plateform after 2015. The current usage metrics is available 48-96 hours after online publication and is updated daily on week days.
Initial download of the metrics may take a while.