Fig. 3
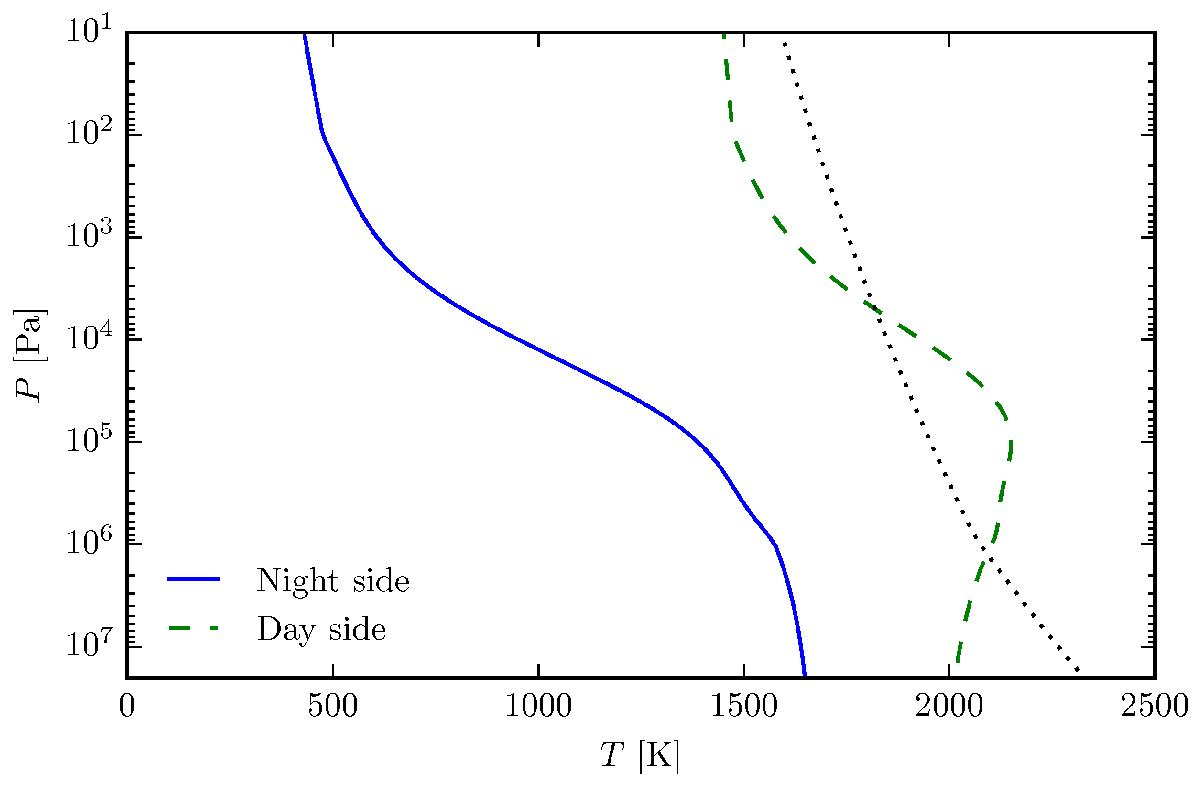
P–T profiles used for the tests in the present work. Profiles are derived from the equilibrium P–T profile of Iro et al. (2005) as adopted by Cooper & Showman (2005, 2006), Rauscher & Menou (2010) and Heng et al. (2011) with the smoothing introduced by Mayne et al. (2014). We adopt the TiO/VO condensation curve from Fortney et al. (2008), plotted as a dotted line.
Current usage metrics show cumulative count of Article Views (full-text article views including HTML views, PDF and ePub downloads, according to the available data) and Abstracts Views on Vision4Press platform.
Data correspond to usage on the plateform after 2015. The current usage metrics is available 48-96 hours after online publication and is updated daily on week days.
Initial download of the metrics may take a while.