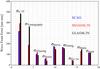
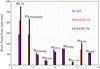
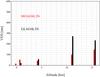
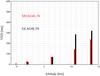
Fig. 9
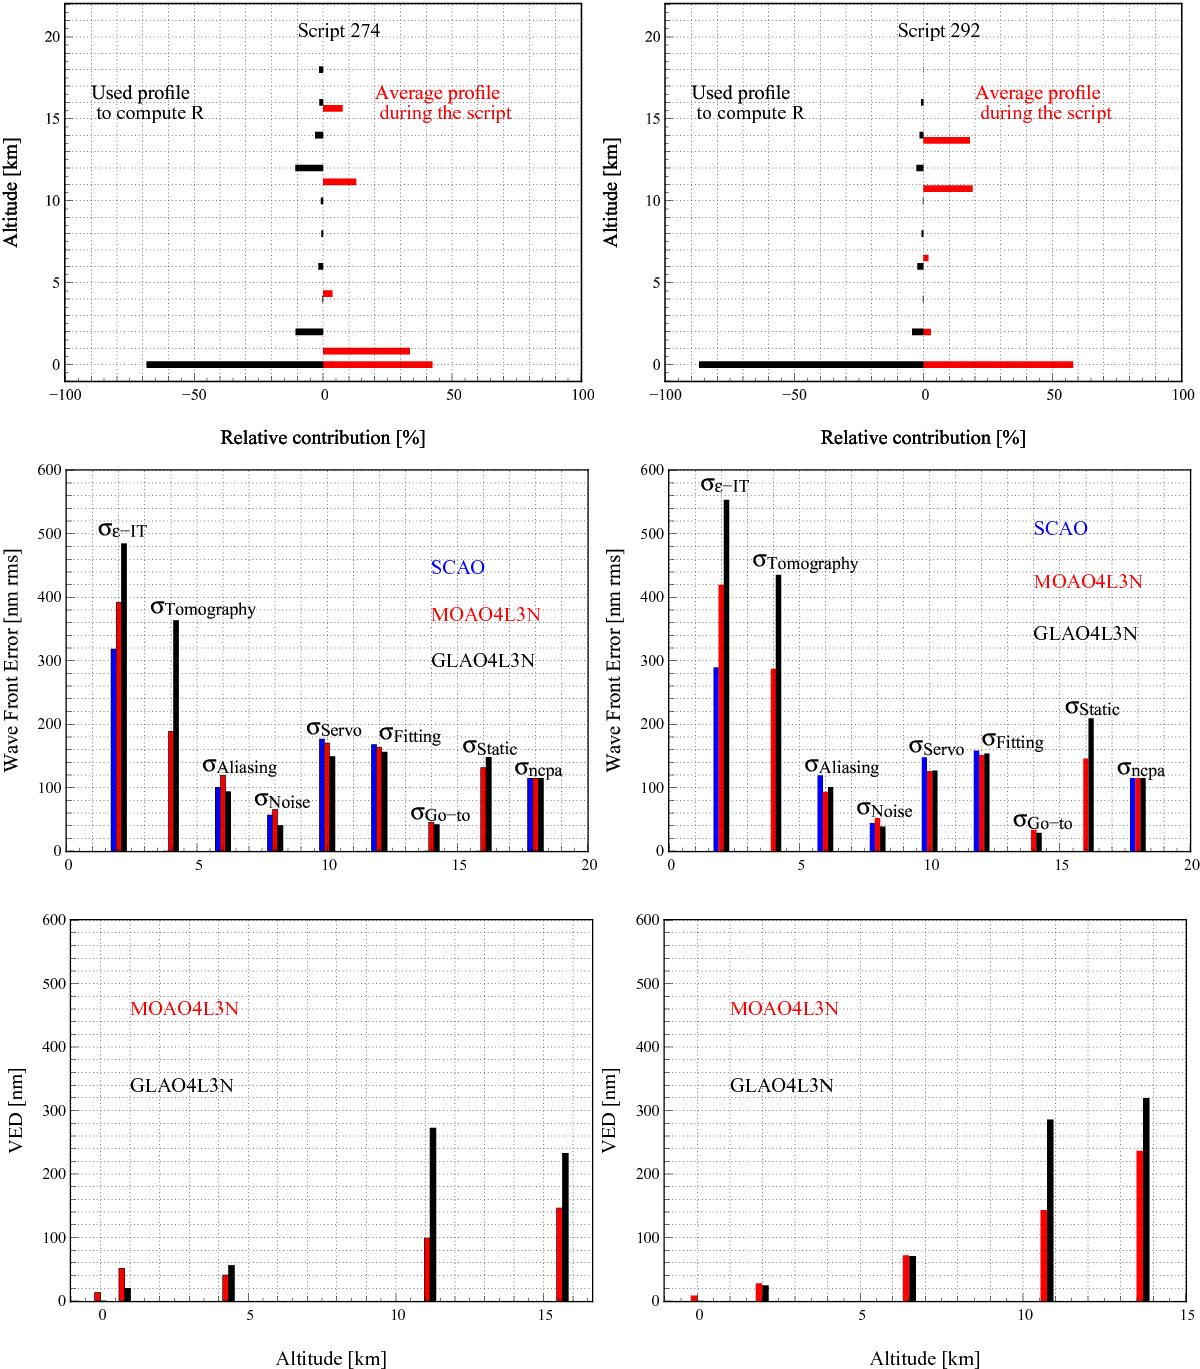
Left: results for script 274. Right: results for script 292. Up: turbulent profiles: expected by the MOAO reconstructor (left), and averaged on the turbulent profiles identified on each data set acquired during the script (right). Middle: error breakdown decomposition for the three AO modes. Each variance has been averaged over the five realizations in the script. Down: tomographic VED for GLAO and MOAO. Each variance has been averaged over the five realizations. The quadratic sum of the VED values gives the tomographic error.
Current usage metrics show cumulative count of Article Views (full-text article views including HTML views, PDF and ePub downloads, according to the available data) and Abstracts Views on Vision4Press platform.
Data correspond to usage on the plateform after 2015. The current usage metrics is available 48-96 hours after online publication and is updated daily on week days.
Initial download of the metrics may take a while.