Free Access
Fig. 7
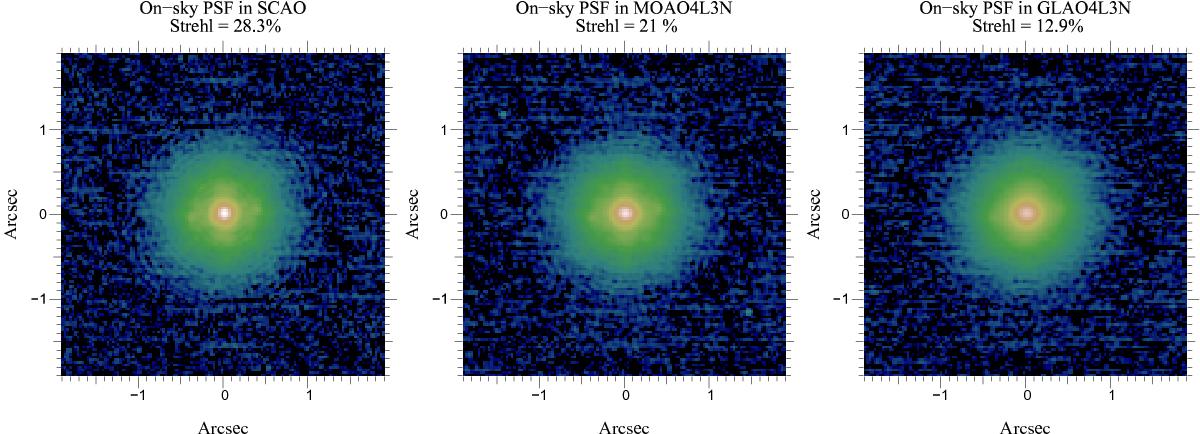
Three AO compensated H-band PSF (log. scale) for SCAO, MOAO and GLAO. Each PSF is averaged on five IR images, not re-centred, acquired on the same AO mode during script 274, the September 13th 2013 night.
This figure is made of several images, please see below:
Current usage metrics show cumulative count of Article Views (full-text article views including HTML views, PDF and ePub downloads, according to the available data) and Abstracts Views on Vision4Press platform.
Data correspond to usage on the plateform after 2015. The current usage metrics is available 48-96 hours after online publication and is updated daily on week days.
Initial download of the metrics may take a while.