Fig. 4
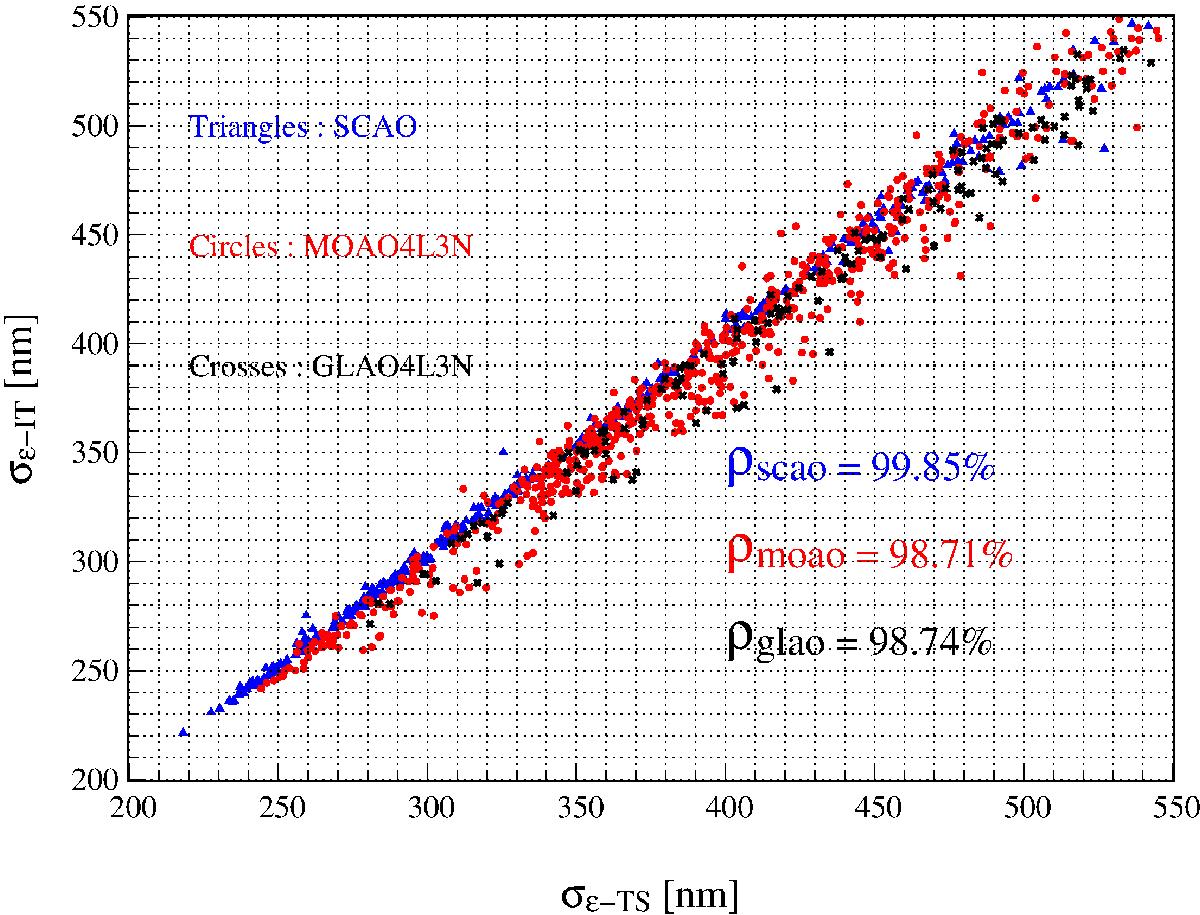
Rms value of the residual phase computed analytically from the IT method versus the empirical one got from the TS method. Less than 1% of the points are off (>1σ), most of them in MOAO. Coefficients given at the right-down corner are the estimation of the correlation factor (Pearson coefficient) between analytic SR and image SR. SCAO=△, MOAO=◯, GLAO=×.
Current usage metrics show cumulative count of Article Views (full-text article views including HTML views, PDF and ePub downloads, according to the available data) and Abstracts Views on Vision4Press platform.
Data correspond to usage on the plateform after 2015. The current usage metrics is available 48-96 hours after online publication and is updated daily on week days.
Initial download of the metrics may take a while.