Free Access
Fig. 8
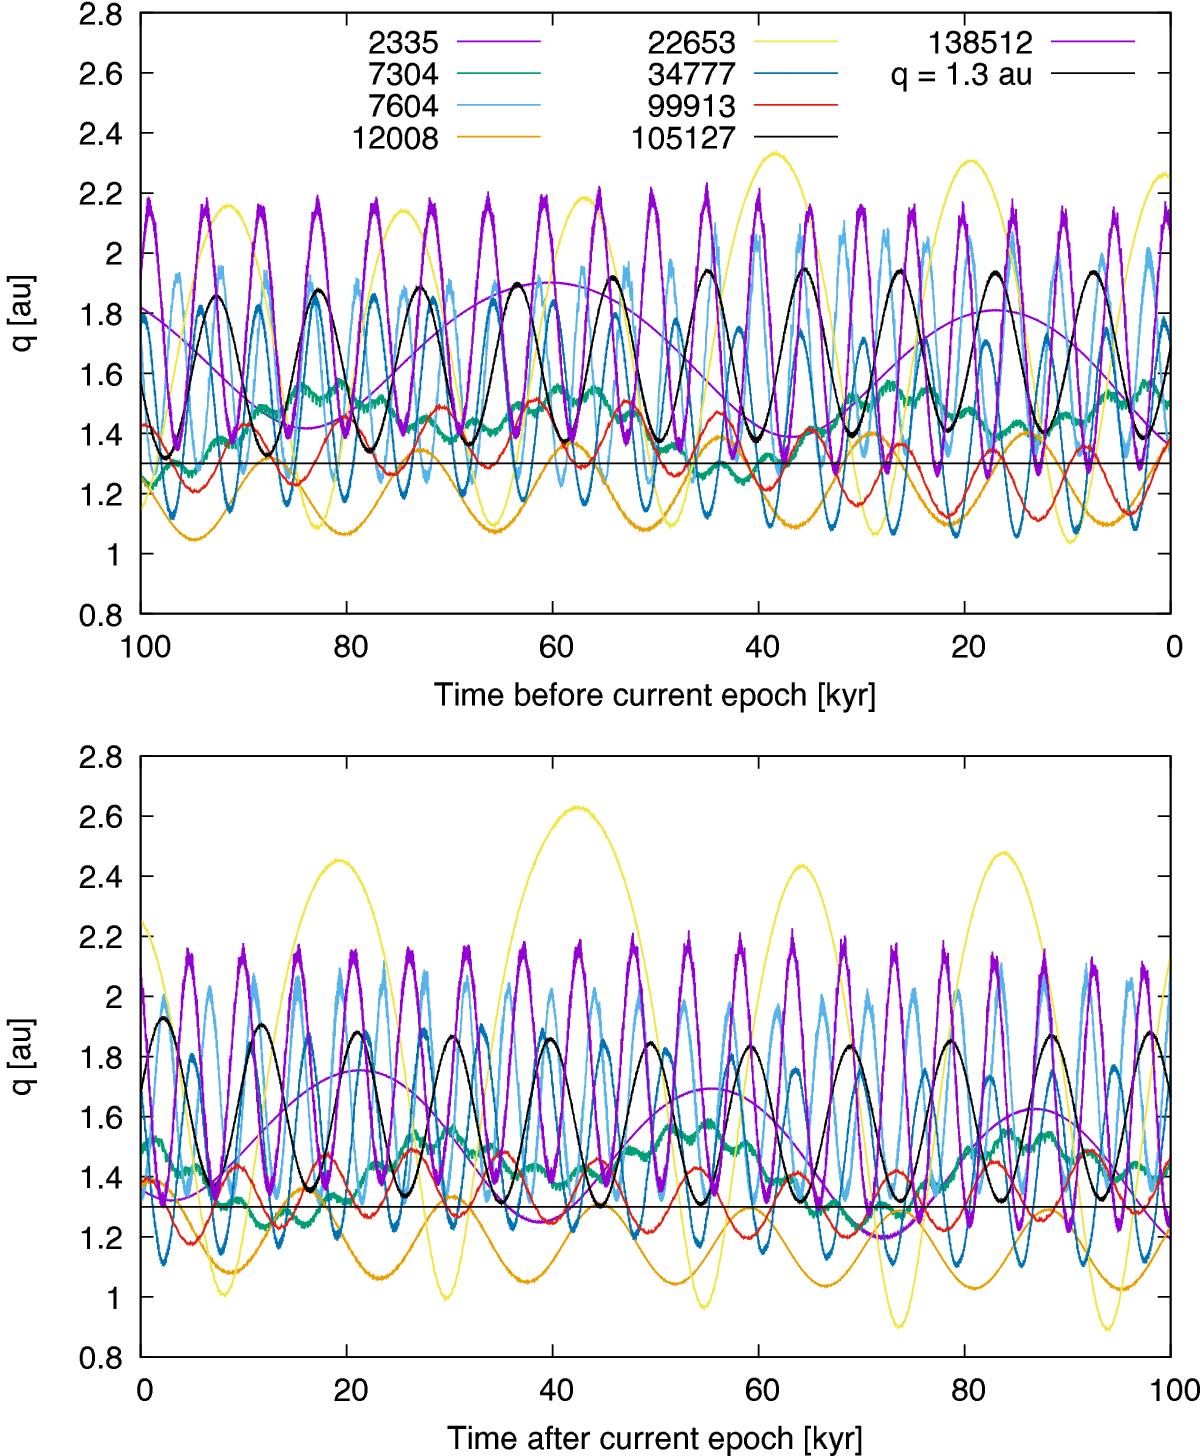
100 kyr backward (top) and forward (bottom) integration of the nine large (H< 13.5) MBOs that enter the NEO region within the next 50 kyr. The integration was carried out with the BS integrator without GR and Yarkovsky.
This figure is made of several images, please see below:
Current usage metrics show cumulative count of Article Views (full-text article views including HTML views, PDF and ePub downloads, according to the available data) and Abstracts Views on Vision4Press platform.
Data correspond to usage on the plateform after 2015. The current usage metrics is available 48-96 hours after online publication and is updated daily on week days.
Initial download of the metrics may take a while.