Free Access
Fig. A.1
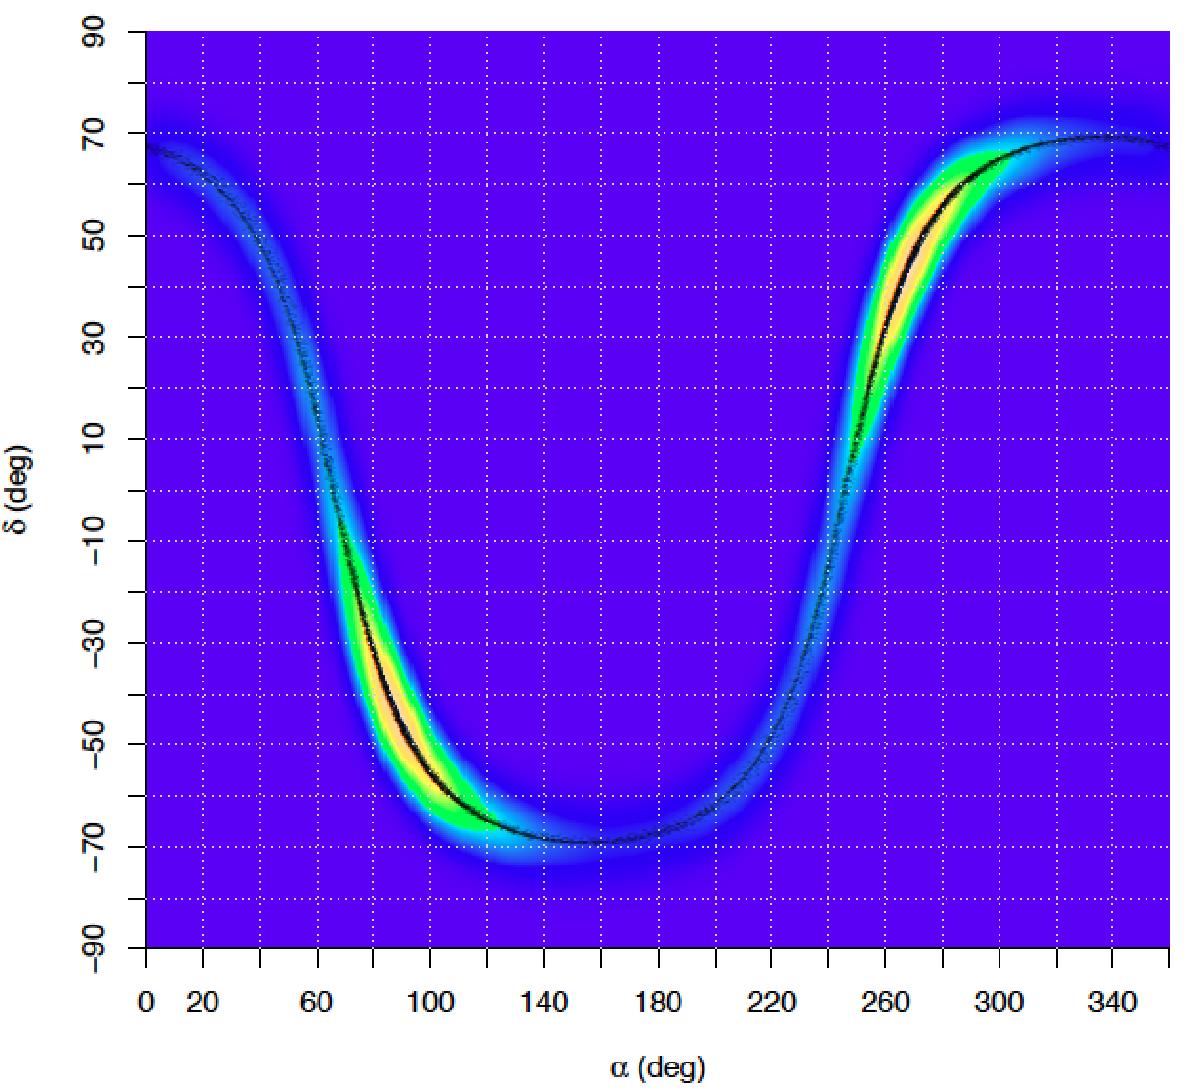
Diagram of great circle intersections for the stars in control sample 1. The colors indicate the regions with highest density of great circle intersections that are close to the CP position (and its mirror point). Each point (black dots) represents the intersection of two great circles in the sample.
Current usage metrics show cumulative count of Article Views (full-text article views including HTML views, PDF and ePub downloads, according to the available data) and Abstracts Views on Vision4Press platform.
Data correspond to usage on the plateform after 2015. The current usage metrics is available 48-96 hours after online publication and is updated daily on week days.
Initial download of the metrics may take a while.