Fig. 9
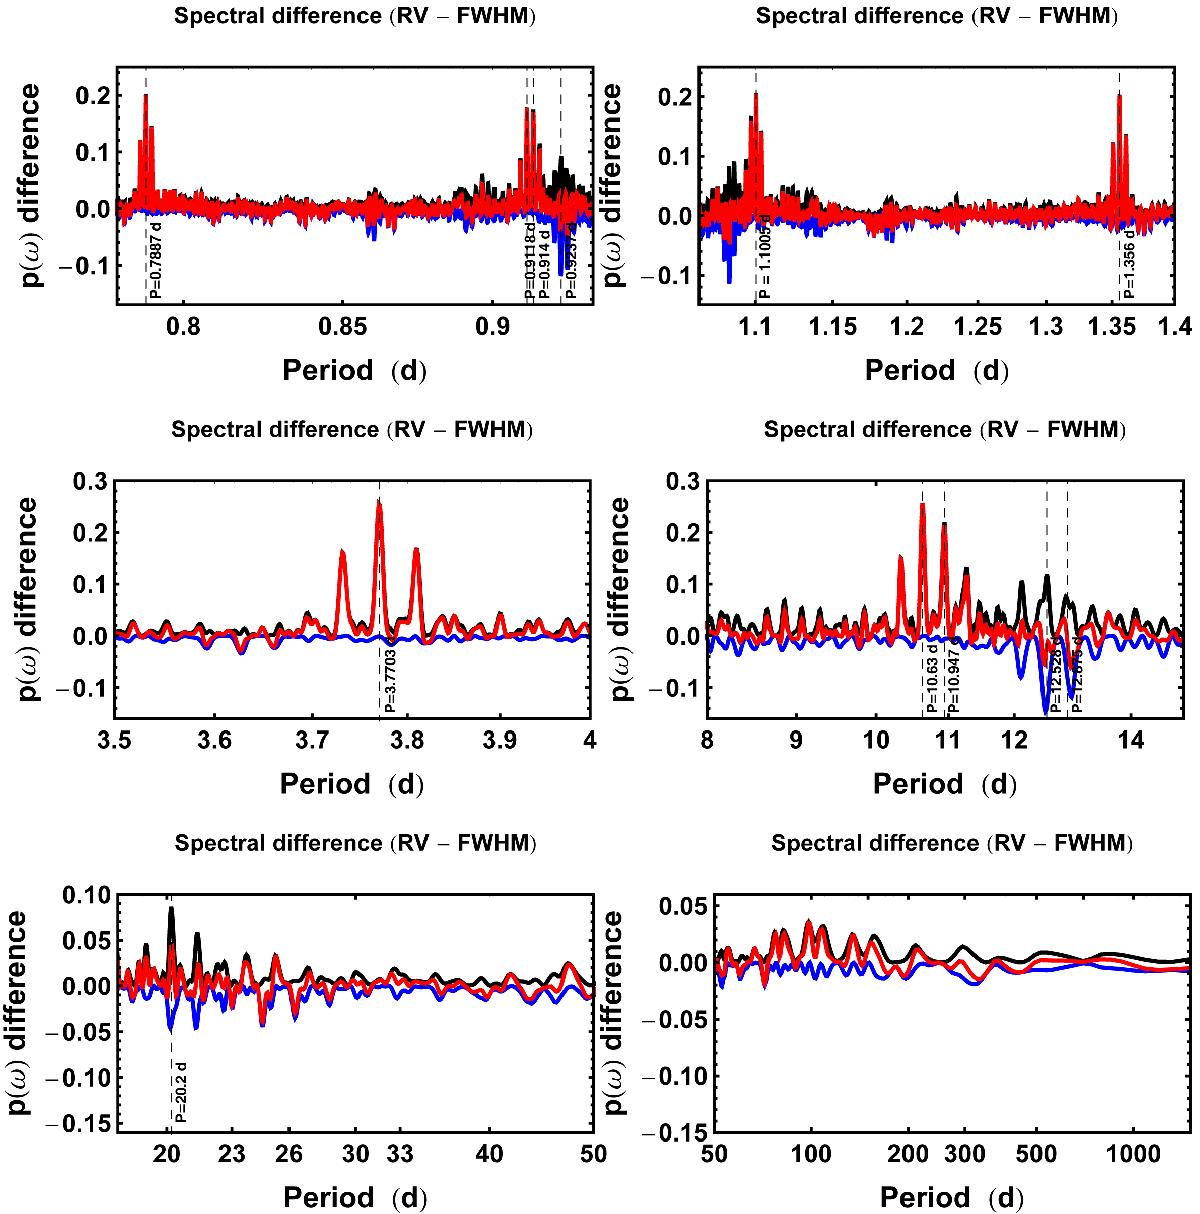
Comparison between GLS periodograms of RV and FWHM data for system 2, each modified by the removal of the best-fit ![]() ) correlation model (hereafter called modified RV and FWHM). There are three traces in each of the 6 panels. The black trace is the modified RV periodogram, the blue trace is the negative of the modified FWHM periodogram, and the red trace is the difference, that is the black trace plus the blue traces. Each plot show an interesting portion of the periodogram. As explained in the text, interesting signals that can be seen in both the modified RV (black) and the modified FWHM (blue) are not fitted as they probably are the result of stellar activity, while signals only present in the modified RVs are considered (Credit: Gregory 2016).
) correlation model (hereafter called modified RV and FWHM). There are three traces in each of the 6 panels. The black trace is the modified RV periodogram, the blue trace is the negative of the modified FWHM periodogram, and the red trace is the difference, that is the black trace plus the blue traces. Each plot show an interesting portion of the periodogram. As explained in the text, interesting signals that can be seen in both the modified RV (black) and the modified FWHM (blue) are not fitted as they probably are the result of stellar activity, while signals only present in the modified RVs are considered (Credit: Gregory 2016).
Current usage metrics show cumulative count of Article Views (full-text article views including HTML views, PDF and ePub downloads, according to the available data) and Abstracts Views on Vision4Press platform.
Data correspond to usage on the plateform after 2015. The current usage metrics is available 48-96 hours after online publication and is updated daily on week days.
Initial download of the metrics may take a while.