Fig. 8
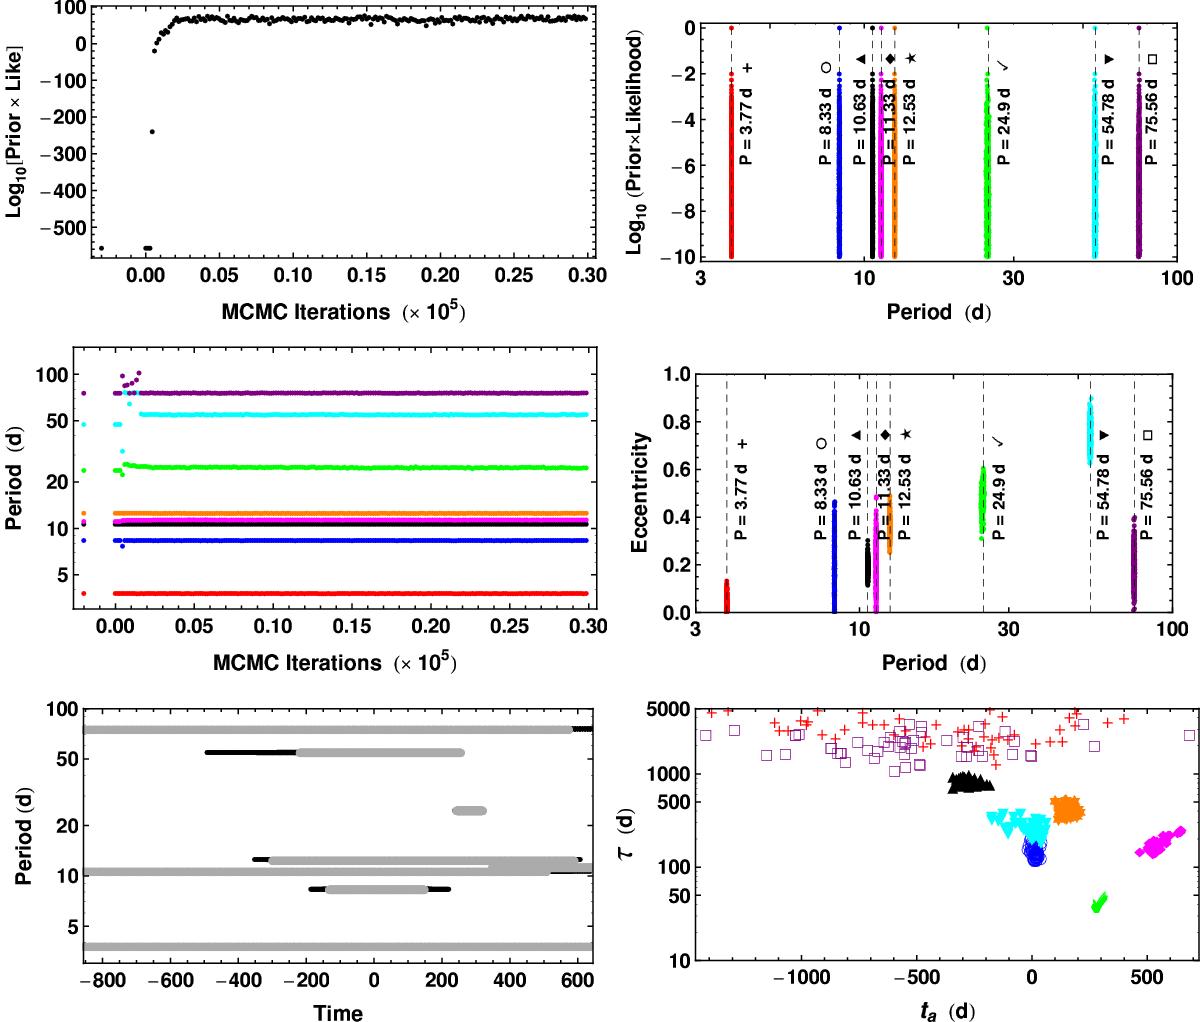
Upper left: Log10 [Prior × Likelihood] versus iterations for the 8 signal apodized Keplerian model used to fit system 2. Upper right: Log10 [Prior × Likelihood] versus period showing the 8 periods detected. Middle left: values of the 8 unknown period parameters versus iteration number. Middle right: eccentricity parameters versus period parameters. Lower left: apodization window for each signal (gray trace for MAP values of the apodization time constant τ and the apodization window center time ta, black for a representative set of samples which is mainly hidden below the gray). Lower right: apodization time constant versus apodization window center time for each signal (Credit: Gregory 2016).
Current usage metrics show cumulative count of Article Views (full-text article views including HTML views, PDF and ePub downloads, according to the available data) and Abstracts Views on Vision4Press platform.
Data correspond to usage on the plateform after 2015. The current usage metrics is available 48-96 hours after online publication and is updated daily on week days.
Initial download of the metrics may take a while.