Fig. 4
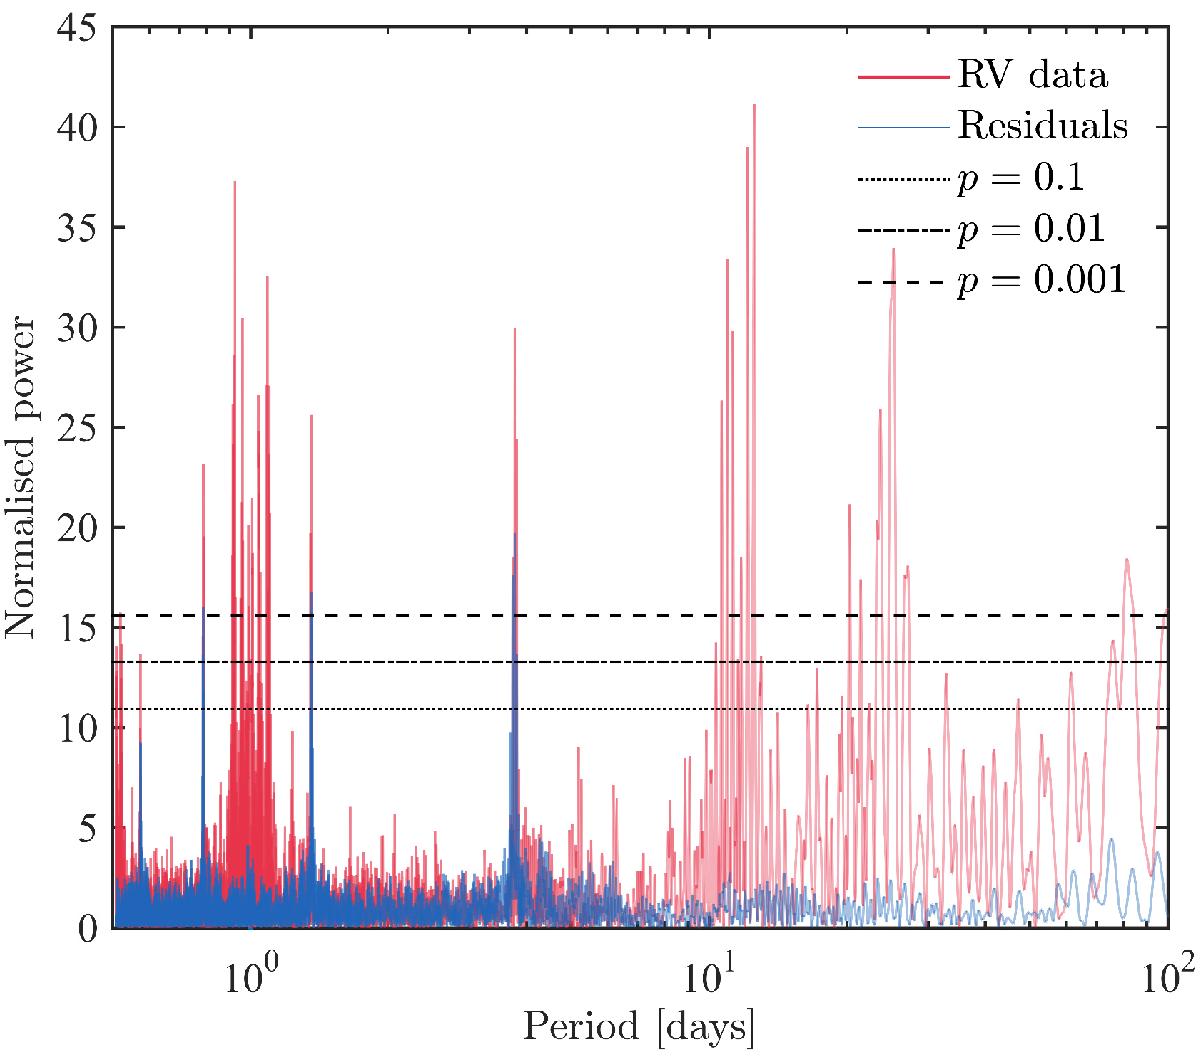
Periodograms of the raw RVs (red) and of the residual RVs (blue) after removing the best GP plus 2-planet model to account for stellar signals and the 3.77 and 10.64-day planets present in the time series. The horizontal lines show from top to bottom the 0.1, 1 and 10% p-values used as a first guess to estimate signal significance. The non-white residuals suggest an imperfect model.
Current usage metrics show cumulative count of Article Views (full-text article views including HTML views, PDF and ePub downloads, according to the available data) and Abstracts Views on Vision4Press platform.
Data correspond to usage on the plateform after 2015. The current usage metrics is available 48-96 hours after online publication and is updated daily on week days.
Initial download of the metrics may take a while.