Fig. 2
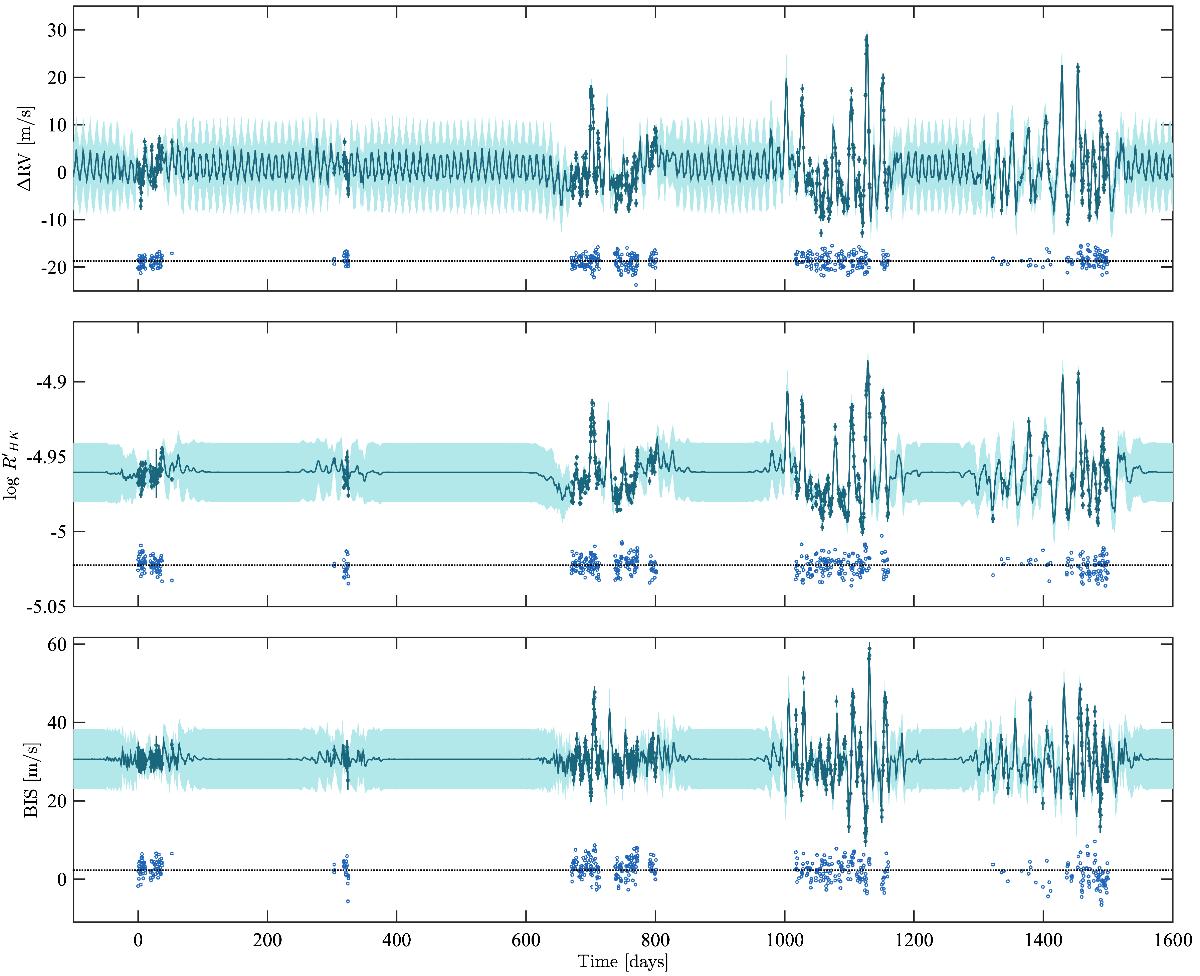
GP model MAP fit to system 2 for which team 2 could recover accurately two of the four injected planetary signals. As in other data sets, the crude pre-processing pipeline used by team 2 wrongly removed signals longer than a couple of months, therefore removing the signal of the 75-day planet present in the data. All plotted time series were fitted simultaneously, using a single set of GP hyperparameters. The green dots indicate the raw time series; the solid lines are model posterior means, and the shaded regions denote ± σ posterior uncertainty. The blue dots indicate model residuals. A zoom on the fourth epoch of observation can be seen in Fig. 3.
Current usage metrics show cumulative count of Article Views (full-text article views including HTML views, PDF and ePub downloads, according to the available data) and Abstracts Views on Vision4Press platform.
Data correspond to usage on the plateform after 2015. The current usage metrics is available 48-96 hours after online publication and is updated daily on week days.
Initial download of the metrics may take a while.