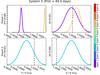
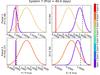
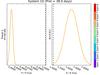
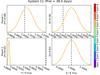
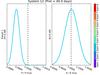
Fig. 16
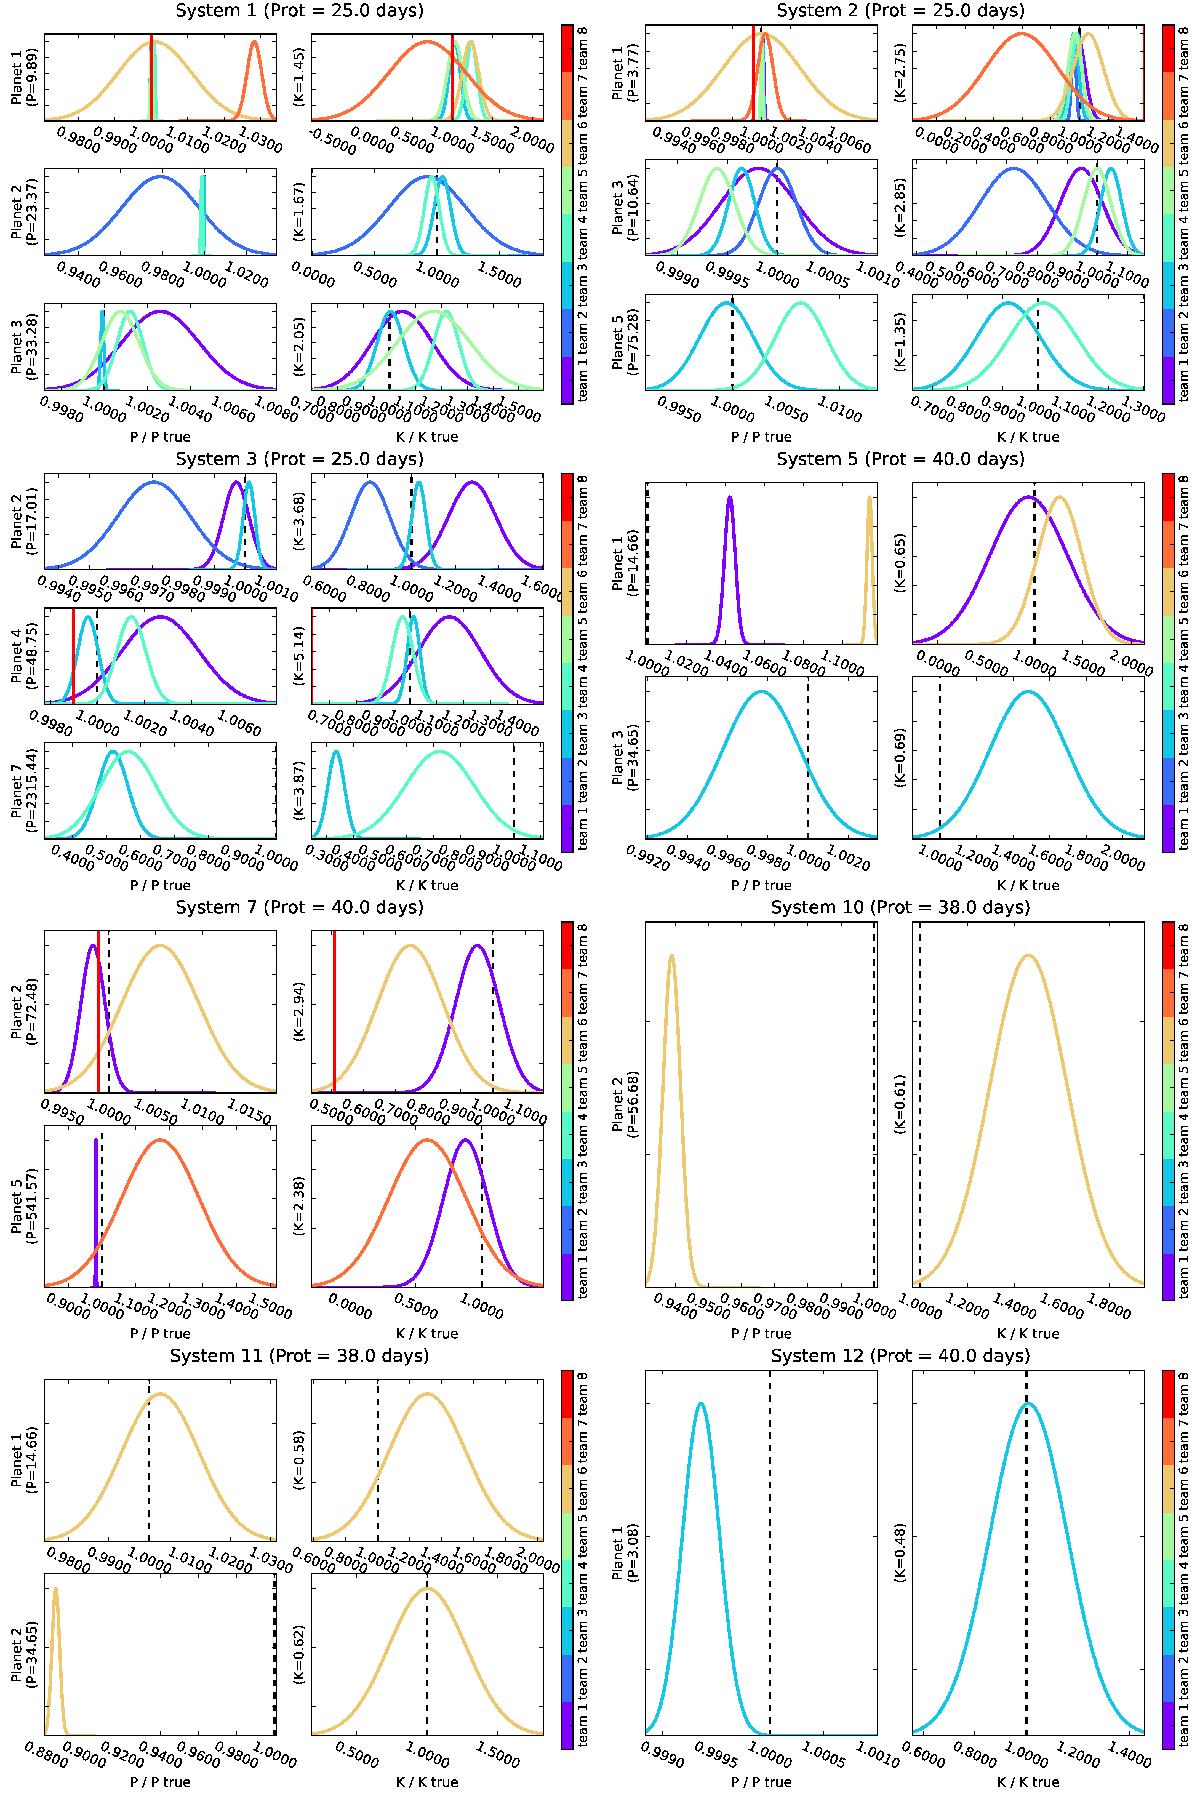
Periods and semi-amplitudes reported by each team for the planets detected in systems 1, 2, 3, 5, 7, 10, 11 and 12. We divided those parameters by the values of the true signals, so that a perfect estimate would fall on one. Team 8 was the only one not reporting error bars on their parameters, therefore we just show their best estimates as red vertical lines.
Current usage metrics show cumulative count of Article Views (full-text article views including HTML views, PDF and ePub downloads, according to the available data) and Abstracts Views on Vision4Press platform.
Data correspond to usage on the plateform after 2015. The current usage metrics is available 48-96 hours after online publication and is updated daily on week days.
Initial download of the metrics may take a while.