Fig. 15
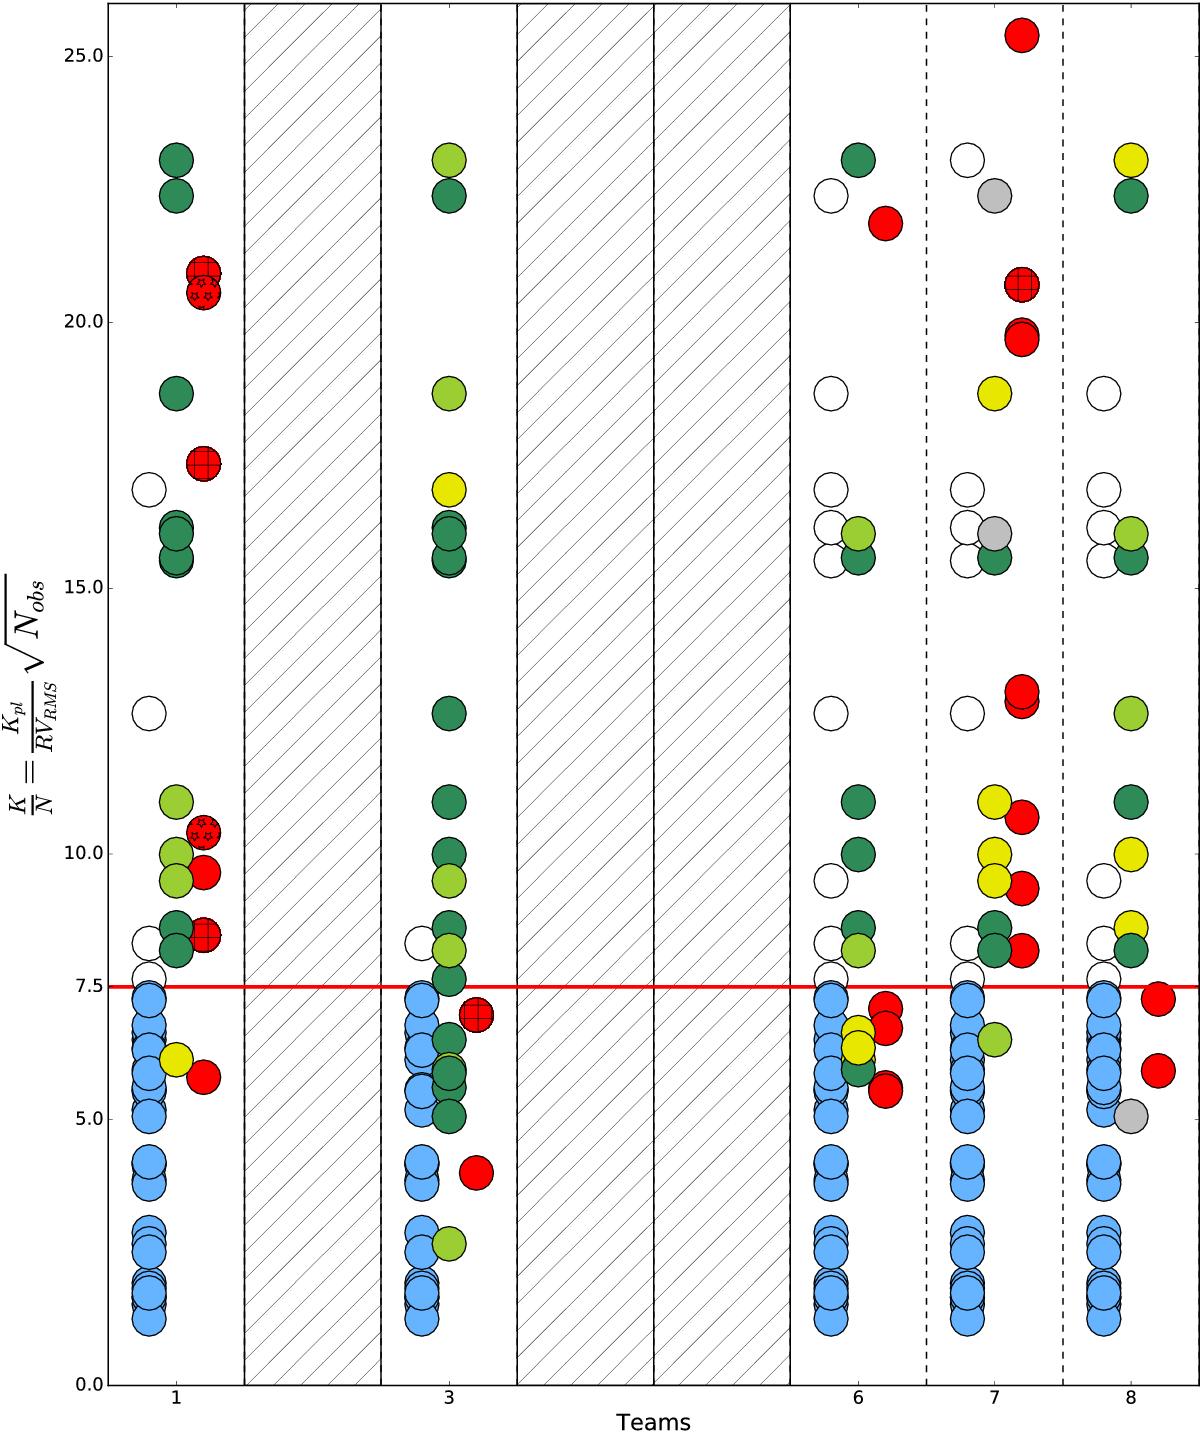
Same as Fig. 14 but for all the signals announced by the different teams in the entire data set of the RV fitting challenge. Only team 1, 3, 6, 7 and 8 performed this full analysis. We separate the false positives or false negatives appearing in red in three categories. Either they cannot be explained easily (plain red dots), or the activity signal at the stellar rotation period has been confused with a planetary signal despite the fact that the correct stellar rotation period was found a priori (hatched red dots) or the activity signal at the stellar rotation period has been confused with a planetary signal when a wrong stellar rotation period was found a priori (red dots with stars).
Current usage metrics show cumulative count of Article Views (full-text article views including HTML views, PDF and ePub downloads, according to the available data) and Abstracts Views on Vision4Press platform.
Data correspond to usage on the plateform after 2015. The current usage metrics is available 48-96 hours after online publication and is updated daily on week days.
Initial download of the metrics may take a while.