Fig. 14
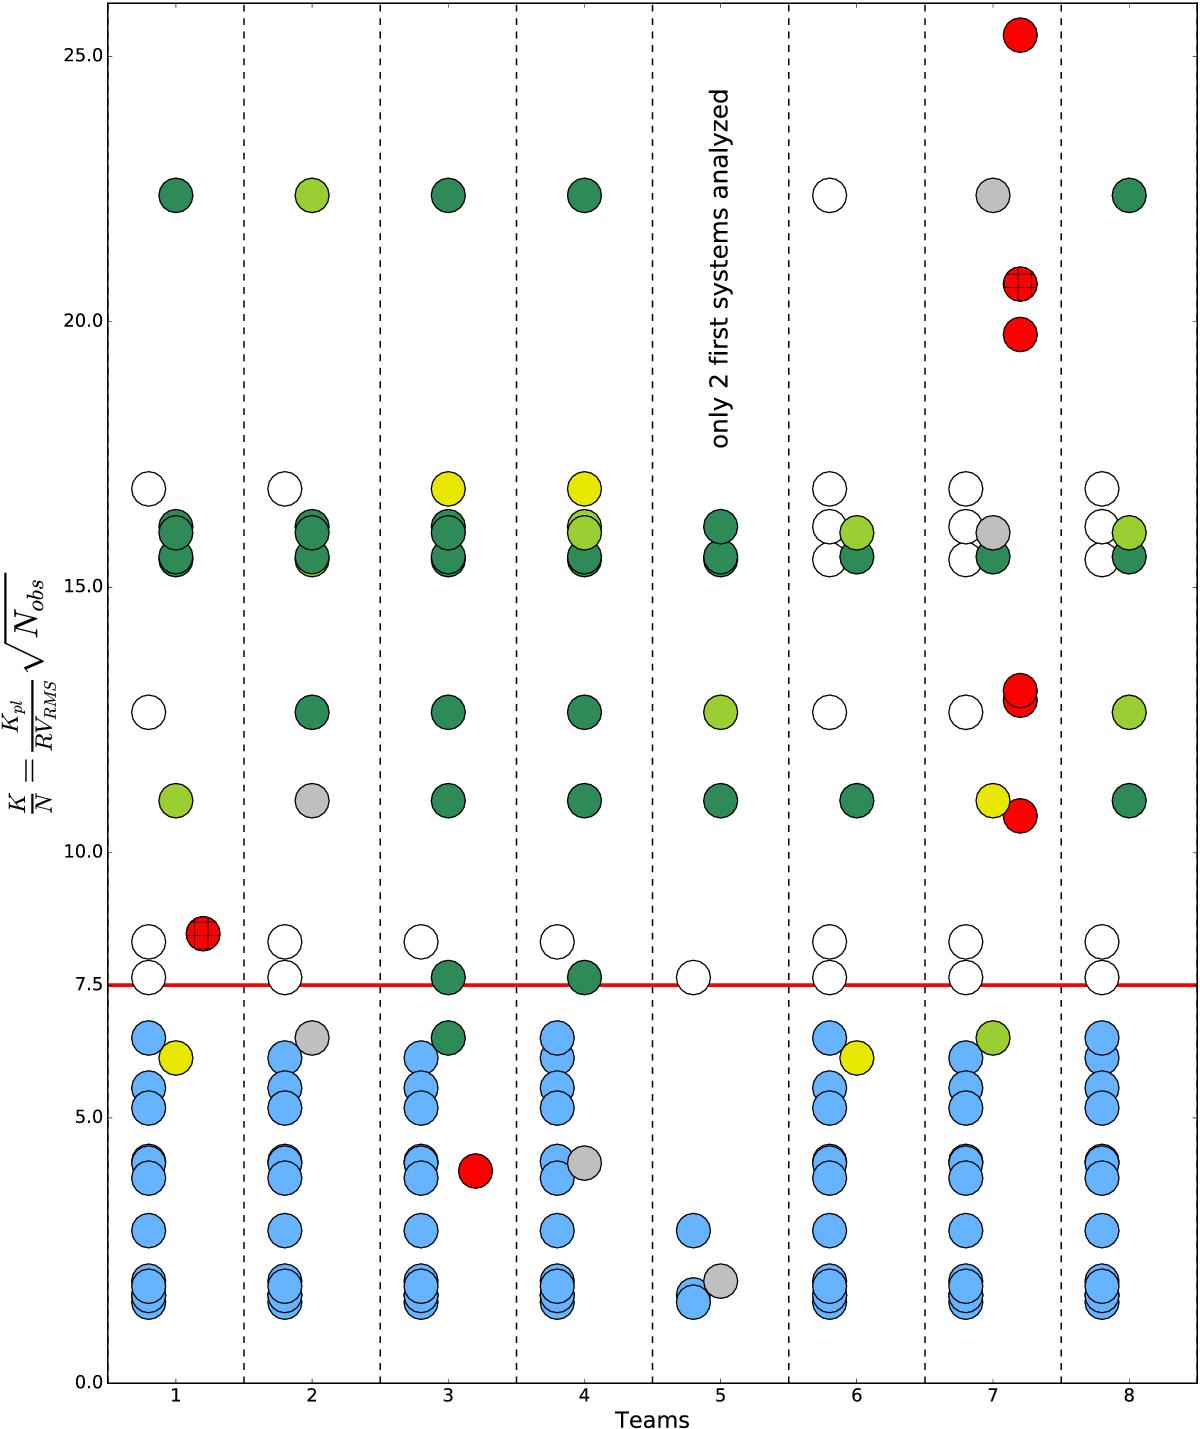
K/N ratio for all the planets present in the 5 first systems of the RV fitting challenge, in addition to the false positives and the false negatives announced for those 5 first systems. All the teams analyzed those 5 first systems, except team 5 that only looked at the first two systems, which explain why there is less dots corresponding to planetary signals. The different color flags are defined in the legend of Fig. 13 and in more details in the second paragraph of Sect. 4.2. We separate the false positives or false negatives appearing in red in two categories. Either they cannot be explained easily (plain red dots), or the activity signal at the stellar rotation period has been confused with a planetary signal despite the fact that the correct stellar rotation period was found a priori (hatched red dots). The red horizontal line corresponds to a K/N ratio of 7.5. The RV rms used to calculate K/N is the rms of the raw RVs once the best-fit of a model consisting of a linear correlation with ![]() ) plus a second order polynomial as a function of time was removed. This model allows removing the effect of magnetic cycles and any long-term drift in the RVs. We removed from this plot the 2 planets in system 11 and 12 that have an orbital period longer than 3000 days, much longer than the timespan of the data, which explain why they were not detected by any team despite their large K/N values (see Sect. 4.2.4).
) plus a second order polynomial as a function of time was removed. This model allows removing the effect of magnetic cycles and any long-term drift in the RVs. We removed from this plot the 2 planets in system 11 and 12 that have an orbital period longer than 3000 days, much longer than the timespan of the data, which explain why they were not detected by any team despite their large K/N values (see Sect. 4.2.4).
Current usage metrics show cumulative count of Article Views (full-text article views including HTML views, PDF and ePub downloads, according to the available data) and Abstracts Views on Vision4Press platform.
Data correspond to usage on the plateform after 2015. The current usage metrics is available 48-96 hours after online publication and is updated daily on week days.
Initial download of the metrics may take a while.