Fig. 13
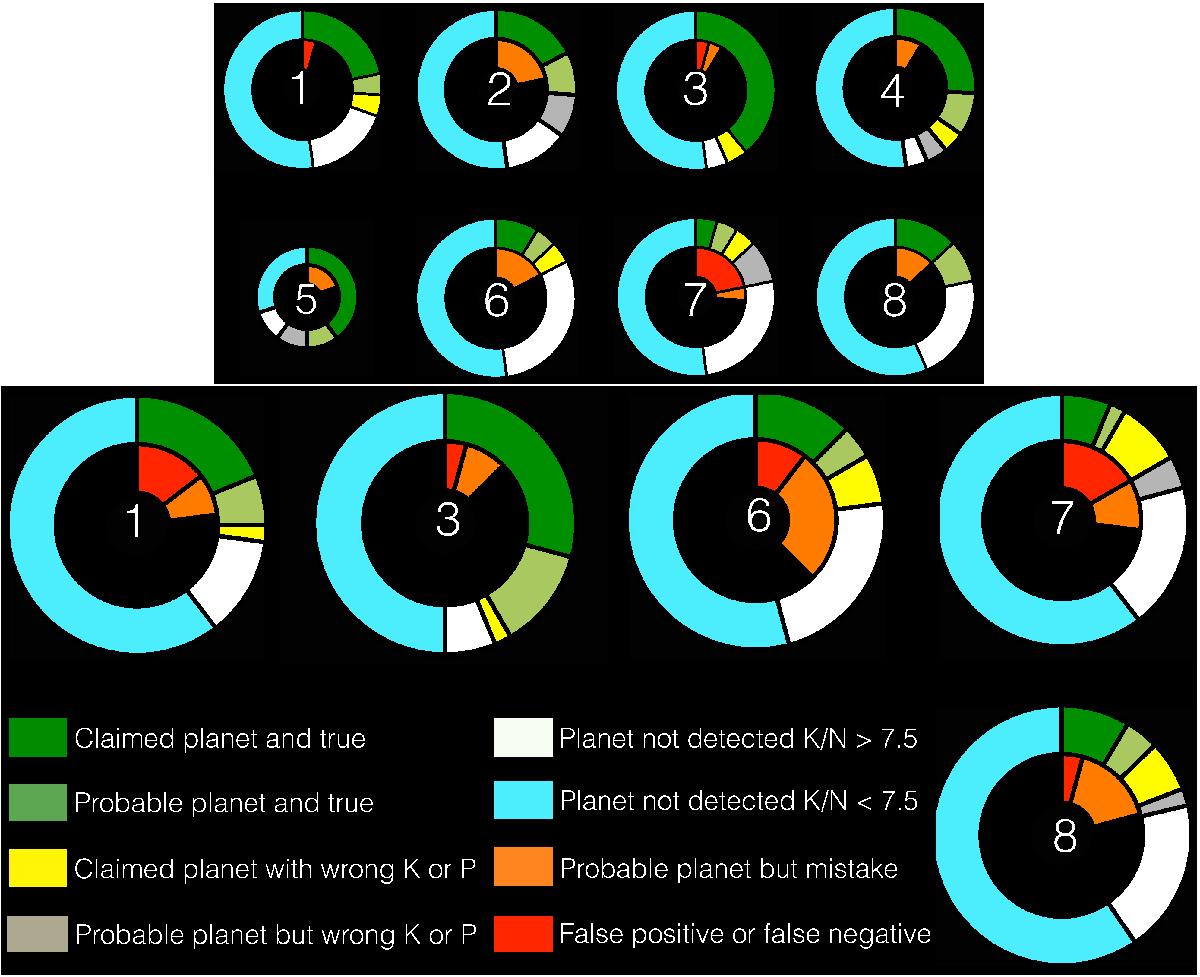
Top: summary of the signals detected in the first 5 systems of the RV fitting challenge data set. All the teams have analyzed those system, expect team 5 that only looked at system 1 and 2. The different color flags are defined in the legend and in more details in the second paragraph of Sect. 4.2. For each team, the outer circle diagram represents true planetary signals that were present in the data, and show how well the different teams could recover those. The inner circle diagram represents signals announced by the teams, but that were not present in the provided RV measurements. Bottom: same but considering all the systems in the RV fitting challenge. Only teams 1, 3, 6, 7 and 8 performed this analysis. Size of the circle diagrams represents the number of systems analyzed: large size for all 14 systems, medium size for the first 5 systems and small size for the first 2 systems.
Current usage metrics show cumulative count of Article Views (full-text article views including HTML views, PDF and ePub downloads, according to the available data) and Abstracts Views on Vision4Press platform.
Data correspond to usage on the plateform after 2015. The current usage metrics is available 48-96 hours after online publication and is updated daily on week days.
Initial download of the metrics may take a while.