Fig. 11
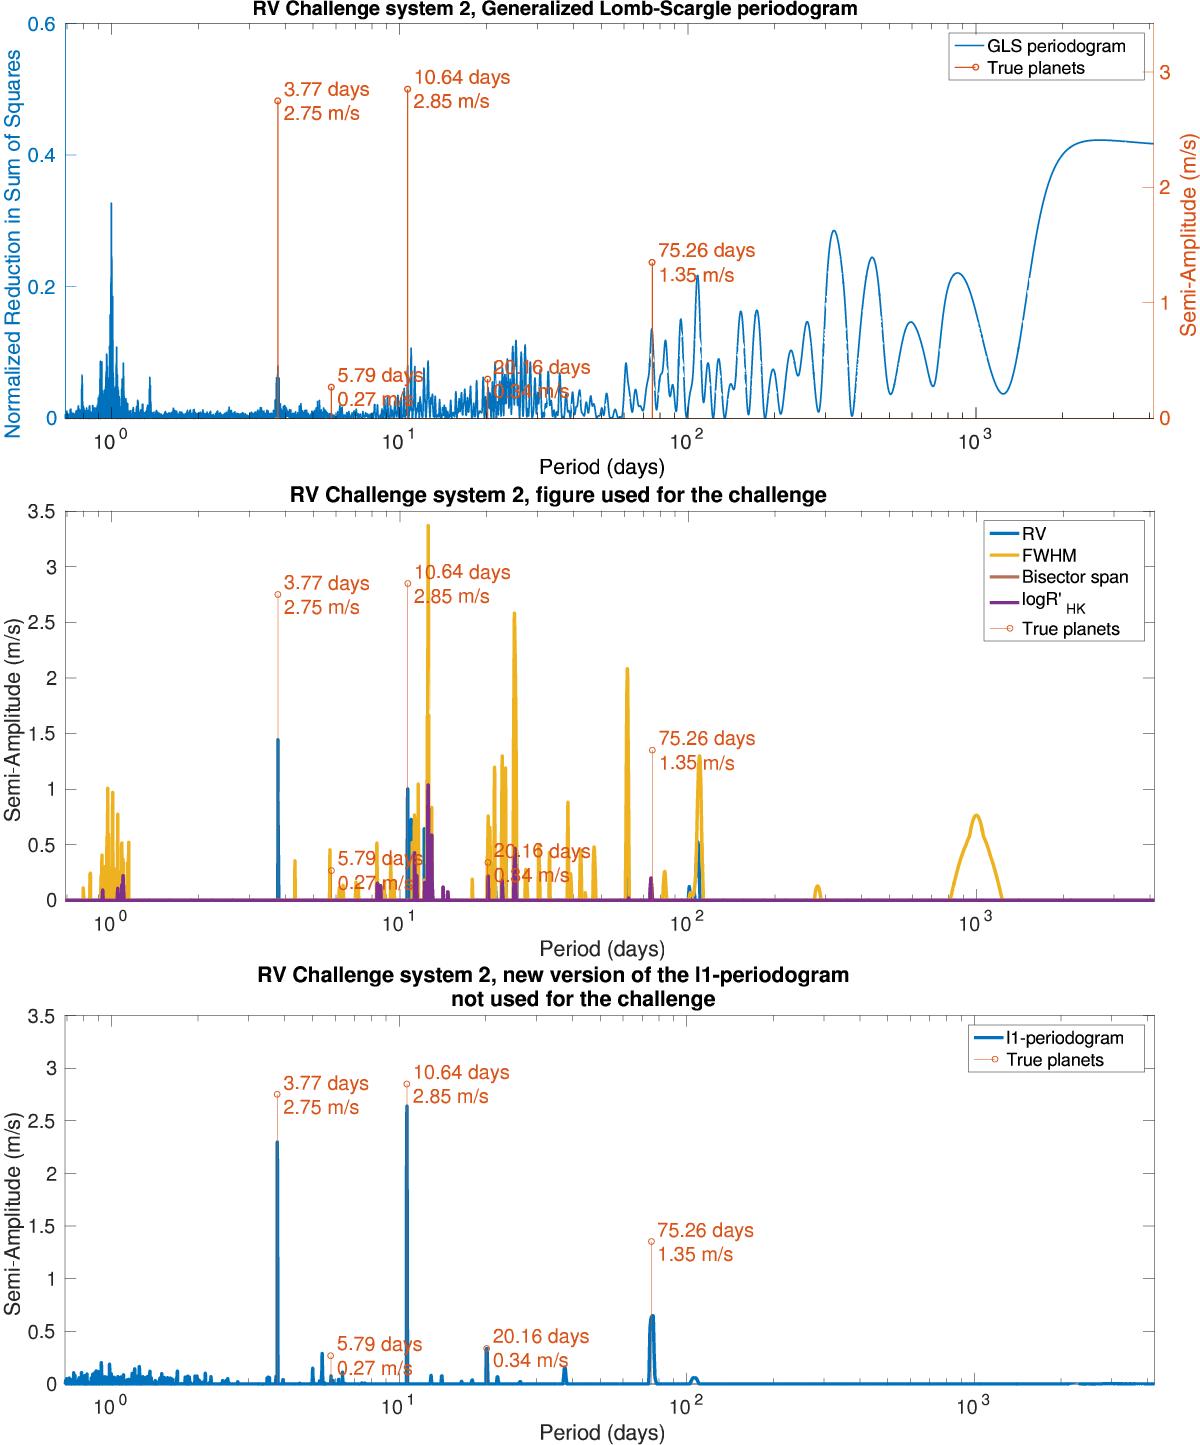
Top: GLS of the RV fitting challenge system 2 (raw time series). The red horizontal lines correspond to the true planetary signals injected into the data. Middle: figure used for the challenge, blue: ℓ1-periodogram of the RVs, yellow: ℓ1-periodogram of FWHM, purple: ℓ1-periodogram of ![]() ). Only the 3.77-day signal was detected by team 8. Bottom: new version of the ℓ1-periodogram (Hara et al. 2017).
). Only the 3.77-day signal was detected by team 8. Bottom: new version of the ℓ1-periodogram (Hara et al. 2017).
Current usage metrics show cumulative count of Article Views (full-text article views including HTML views, PDF and ePub downloads, according to the available data) and Abstracts Views on Vision4Press platform.
Data correspond to usage on the plateform after 2015. The current usage metrics is available 48-96 hours after online publication and is updated daily on week days.
Initial download of the metrics may take a while.