Fig. 1
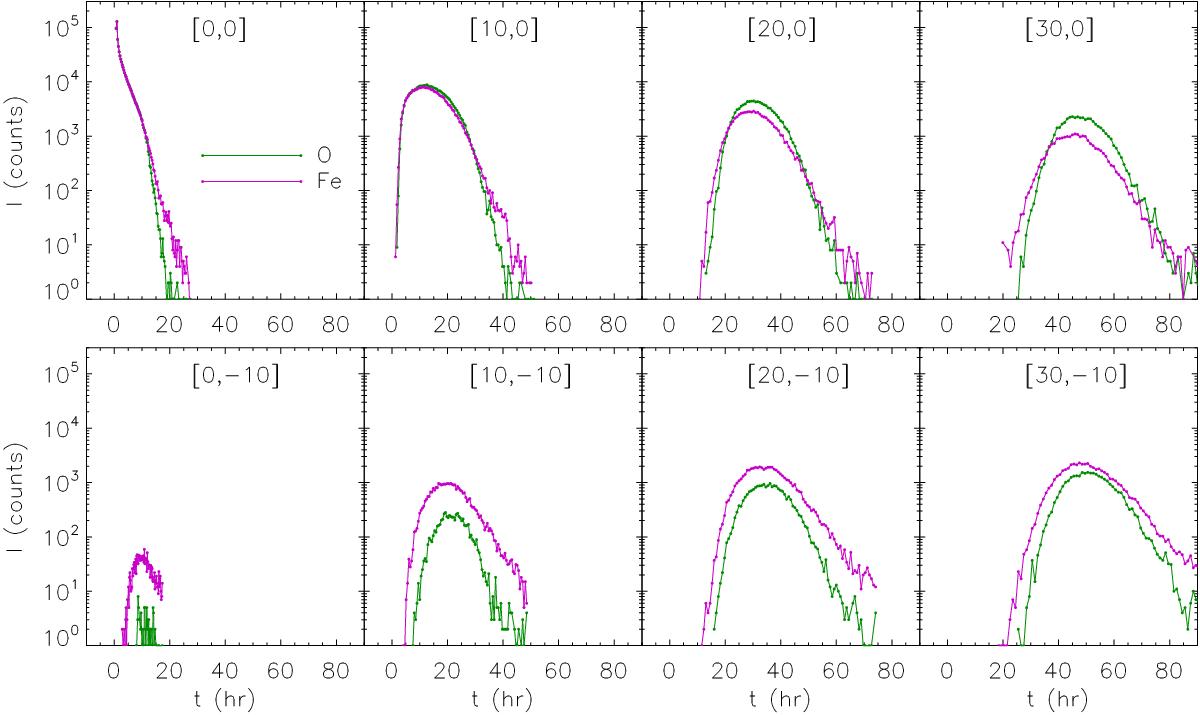
Fe (magenta line) and O (green line) intensities versus time for the energy range 10–30 MeV nucleon-1 at various 1 AU locations relative to the magnetic field line connected to the centre of the injection region at the Sun. Labels in each panel give the observer’s angular position as [Δφ1 AU,Δδ1 AU], where Δφ1 AU is the heliographic longitude and Δδ1 AU the heliographic latitude relative to the position of the Parker spiral field line through to the centre of the injection region. Here λ = 1 AU. The same number of Fe and O ions were injected.
Current usage metrics show cumulative count of Article Views (full-text article views including HTML views, PDF and ePub downloads, according to the available data) and Abstracts Views on Vision4Press platform.
Data correspond to usage on the plateform after 2015. The current usage metrics is available 48-96 hours after online publication and is updated daily on week days.
Initial download of the metrics may take a while.