Fig. 5
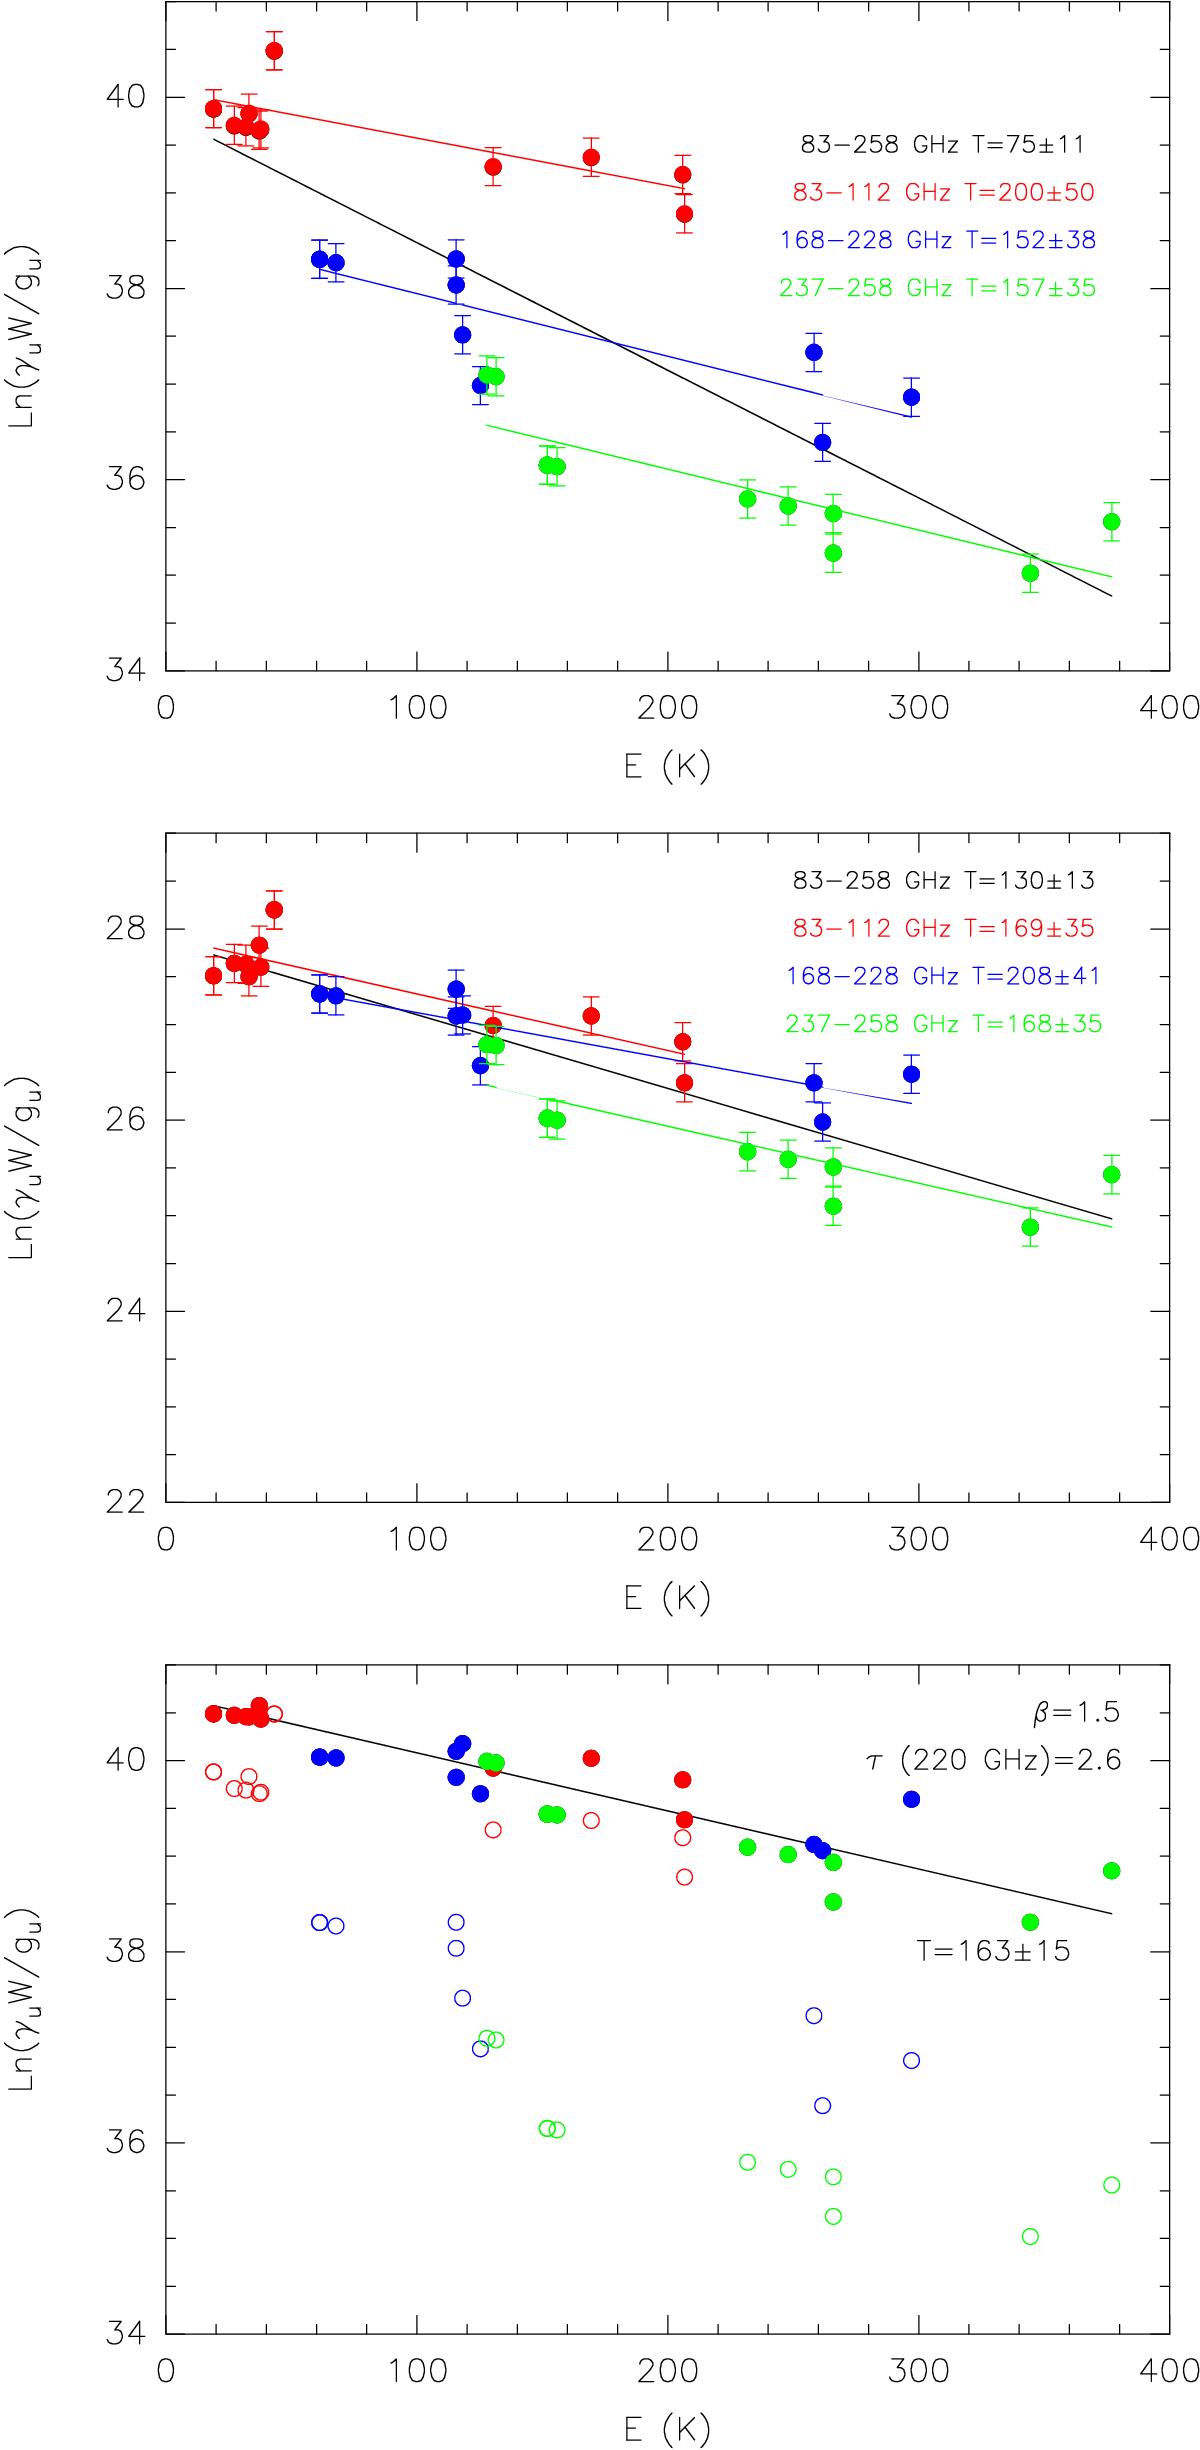
Upper panel: rotational diagram of MF considering the beam dilution factor. The different colors indicate transitions in the different frequency ranges indicated by the labels. The black line is the best fit considering all transitions, while the colored lines are the best fits considering only the transitions in the same frequency range. Middle panel: same as upper panel, without considering beam dilution, i.e., assuming that the molecular emission completely fills the telescope beam. Lower panel: same as upper panel after correcting the line intensities for the dust opacity (solid circles) and without correction (open circles).
Current usage metrics show cumulative count of Article Views (full-text article views including HTML views, PDF and ePub downloads, according to the available data) and Abstracts Views on Vision4Press platform.
Data correspond to usage on the plateform after 2015. The current usage metrics is available 48-96 hours after online publication and is updated daily on week days.
Initial download of the metrics may take a while.