Fig. 4
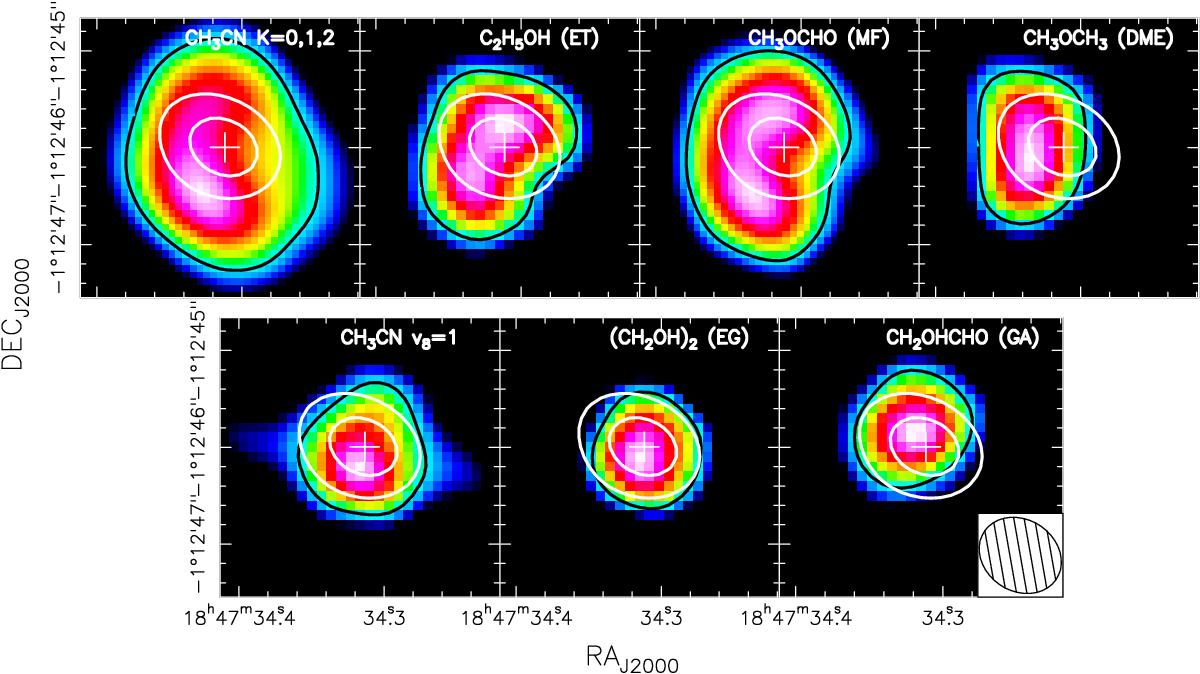
Integrated emission maps of different COMs towards G31. All the maps have been obtained with the combination of the very extended and compact SMA data. The color scale in each panel spans from 30% to 100% of the line intensity peak. The frequencies (and upper energies) of the lines are: 220.747 GHz (69 K), 220.743 GHz (76 K), and 220.730 GHz (97 K) for CH3CN; 230.991 GHz (85 K) for ET; 229.405 GHz (111 K) and 229.420 (111 K) for MF; 230.234 (148 K) for DME; 221.228 GHz (698 K) for CH3CN v8 = 1; 221.100 (137 K) for EG; and 230.898 (131 K) for GA. The black solid line indicates the isocontour with 50% of the peak line intensity. The two white contours correspond to 50% and 80% of the peak value of the 1.3 mm continuum. The white plus sign indicates the positions of the peak of the 1.3 mm continuum. The beam of the interferometer is shown in the lower right corner of the lower right panel.
Current usage metrics show cumulative count of Article Views (full-text article views including HTML views, PDF and ePub downloads, according to the available data) and Abstracts Views on Vision4Press platform.
Data correspond to usage on the plateform after 2015. The current usage metrics is available 48-96 hours after online publication and is updated daily on week days.
Initial download of the metrics may take a while.