Fig. 3
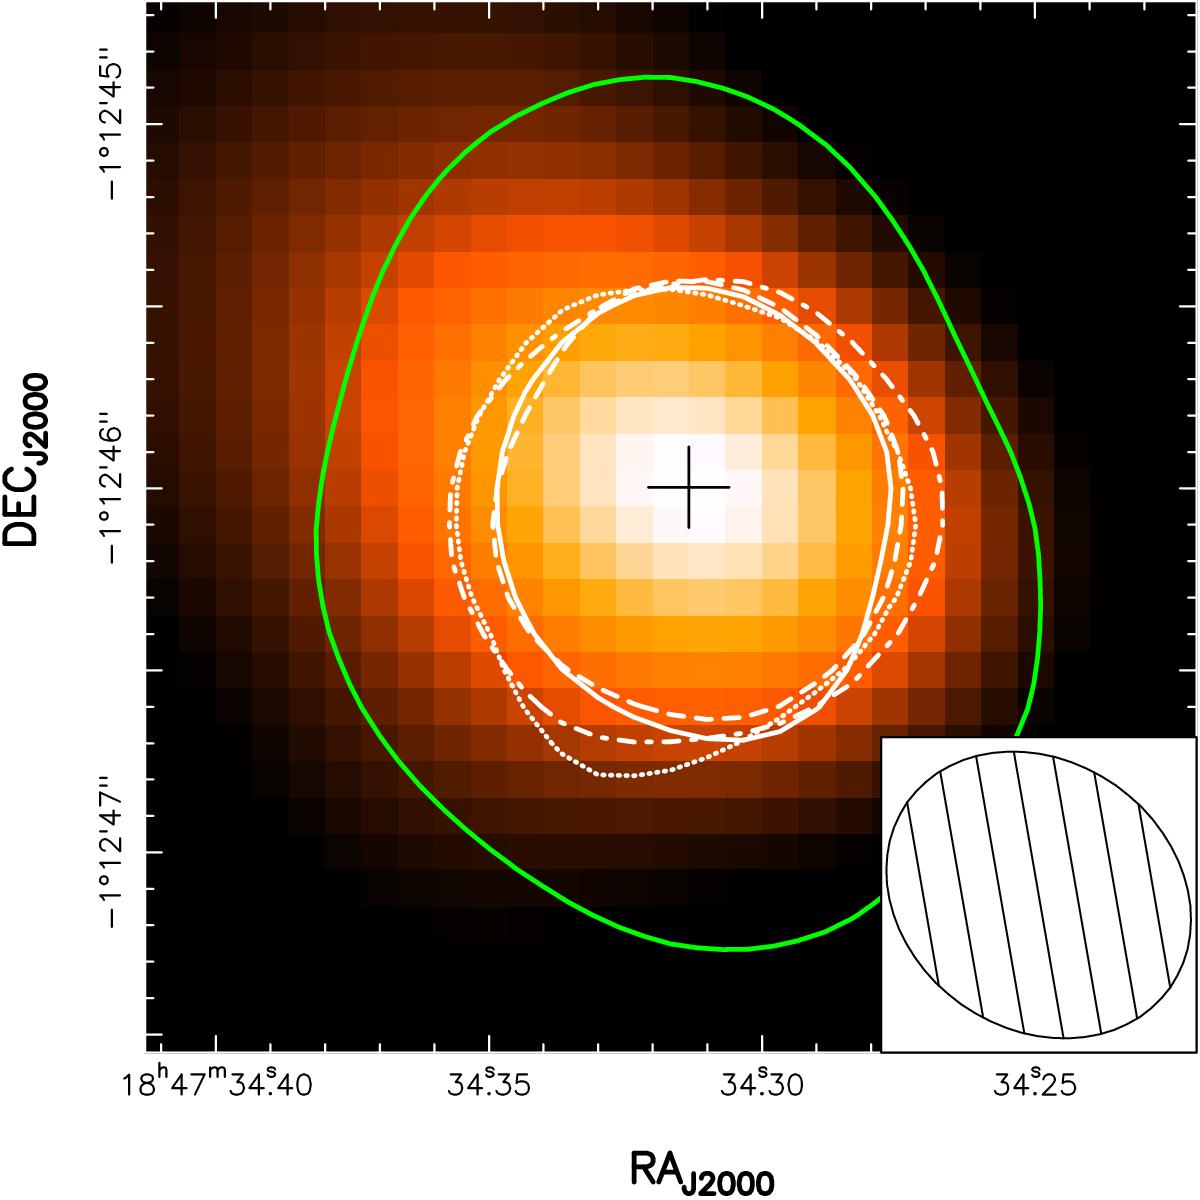
Spatial distribution of EG transitions at 221.03880 GHz (white solid), 221.10032 GHz (white dashed), 230.57714 GHz (white dotted), and 230.830 GHZ (white dot-dashed), overplotted on the 1.3 mm continuum observed with the SMA (color scale). The black plus sign indicates the position of the peak of the 1.3 mm continuum. For comparison, we have also added the spatial distribution of the integrated emission of K = 0, 1, 2 CH3CN line (solid green line). All contours show the isocontour with 50% of the peak line intensity. The beam of the interferometer is shown in the lower right corner.
Current usage metrics show cumulative count of Article Views (full-text article views including HTML views, PDF and ePub downloads, according to the available data) and Abstracts Views on Vision4Press platform.
Data correspond to usage on the plateform after 2015. The current usage metrics is available 48-96 hours after online publication and is updated daily on week days.
Initial download of the metrics may take a while.