Fig. 2
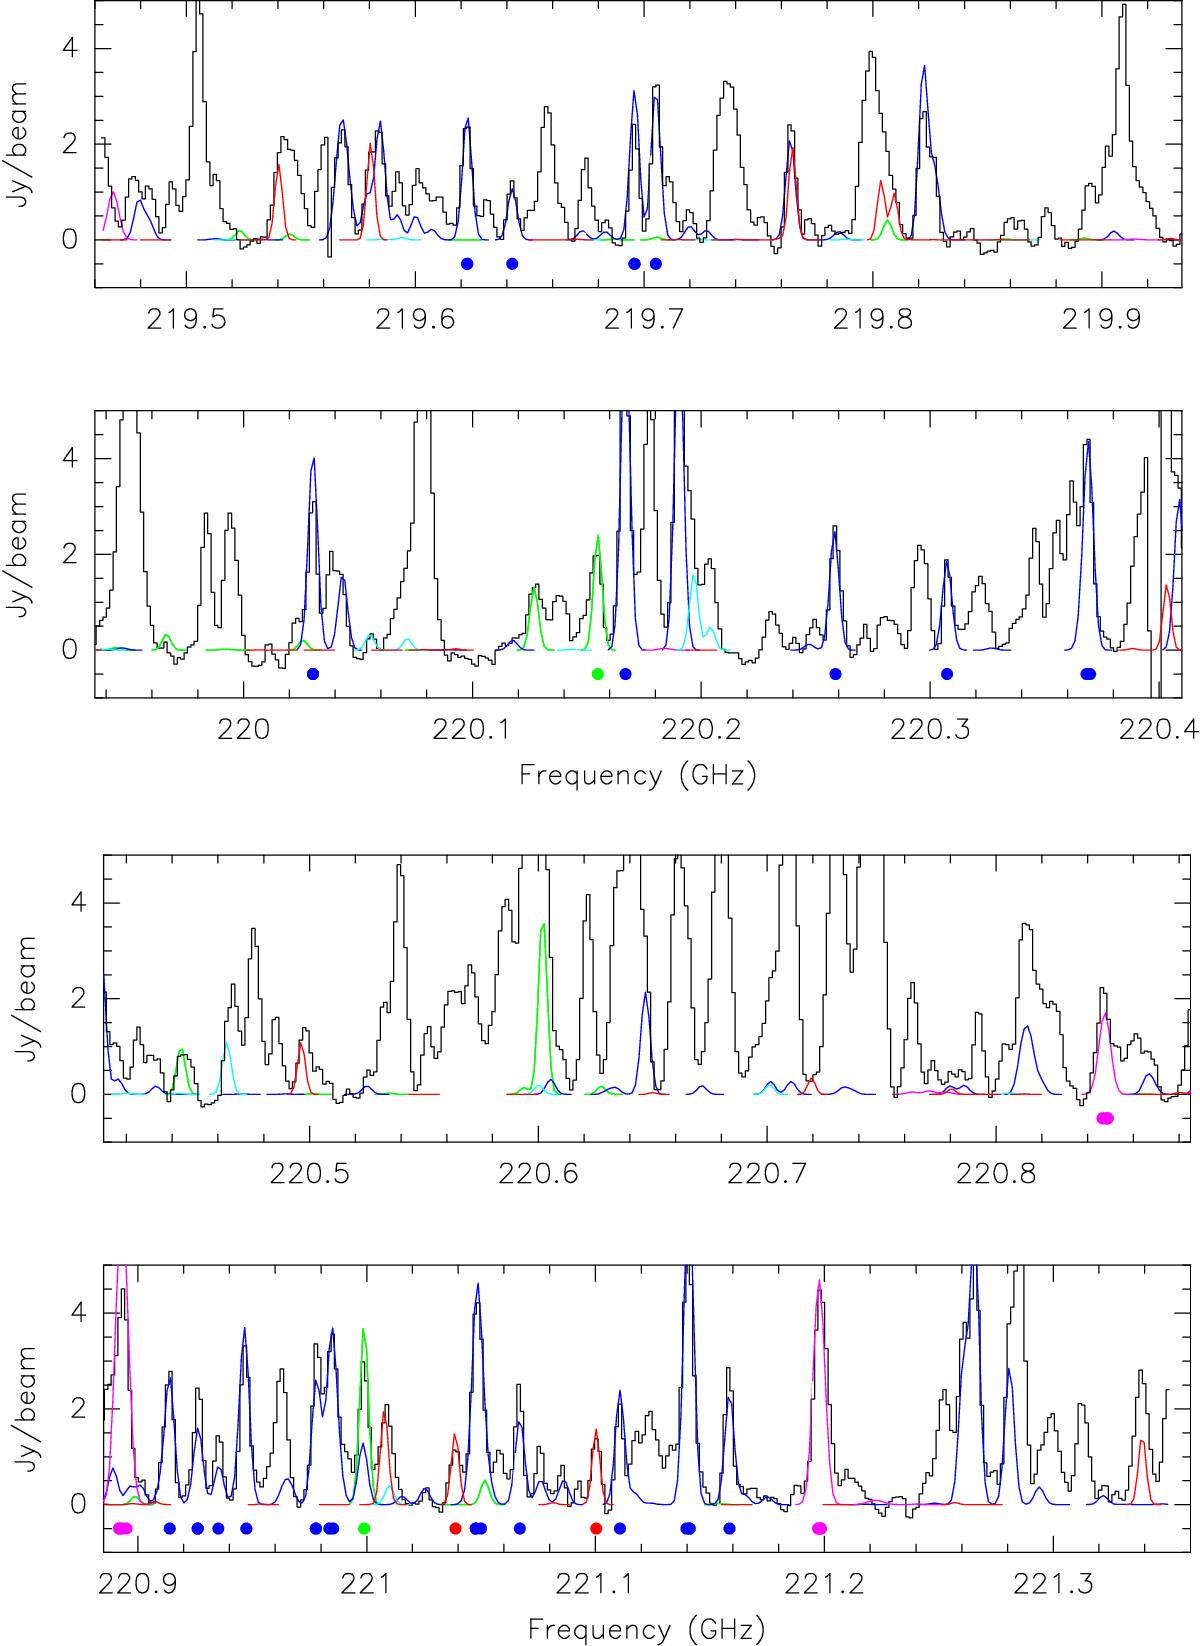
Spectrum towards the peak of the continuum of the SMA compact data. We have overplotted the LTE synthetic spectrum of the different COMs obtained with MADCUBAIJ: EF (red), GA (light blue), MF (dark blue), DME (magenta), and ET (green). The colored circles indicate the unblended lines given in Table 4 and Tables B.2, B.4, B.6, and B.8. The physical parameters used are shown in Table C.2.
Current usage metrics show cumulative count of Article Views (full-text article views including HTML views, PDF and ePub downloads, according to the available data) and Abstracts Views on Vision4Press platform.
Data correspond to usage on the plateform after 2015. The current usage metrics is available 48-96 hours after online publication and is updated daily on week days.
Initial download of the metrics may take a while.