Fig. 1
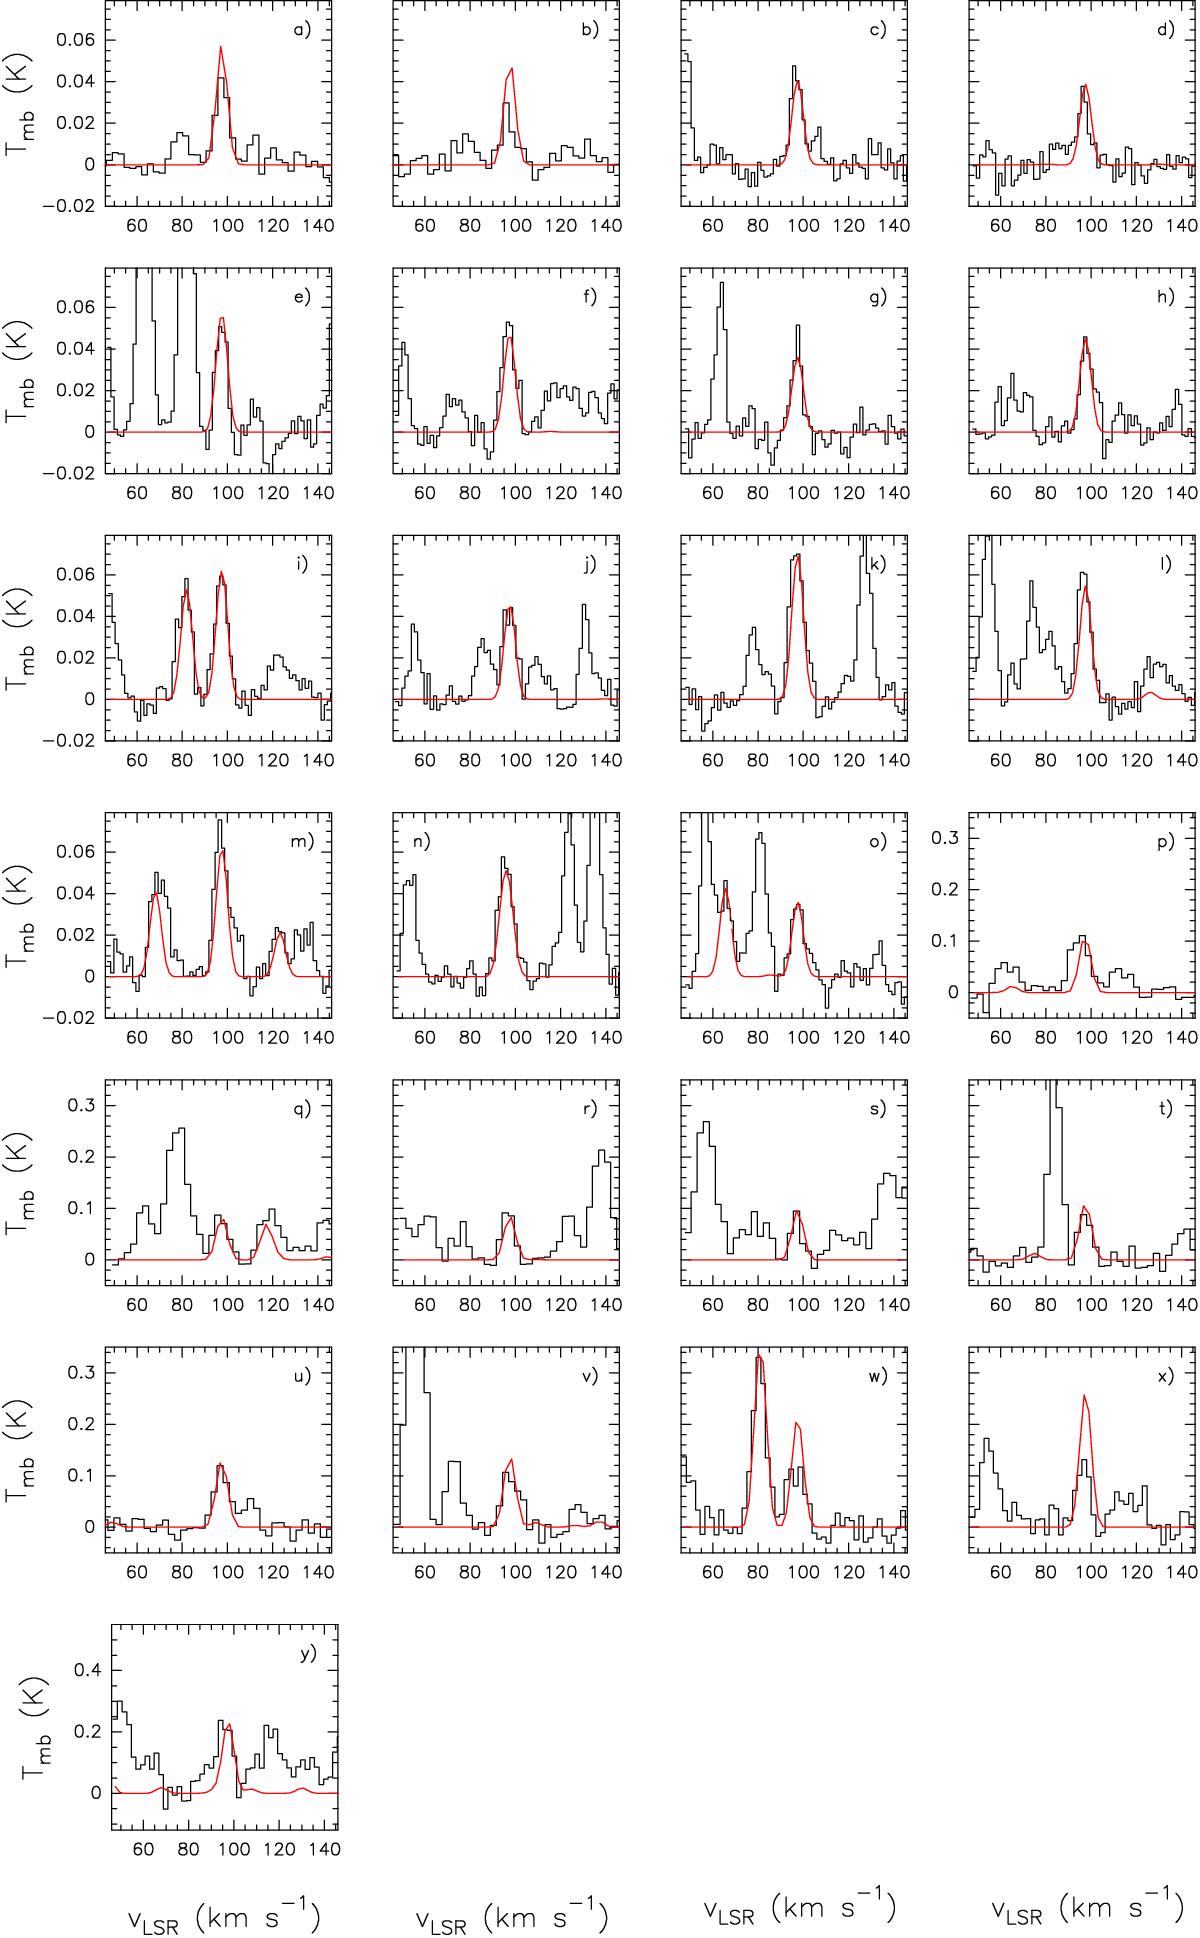
Unblended transitions of EG from single-dish observations. The spectroscopic parameters (rest frequencies, quantum numbers, energies of the upper levels, and integrated intensities) from the LTE fit are listed in Table 3. For identification purposes, we have overplotted in red the LTE synthetic spectrum obtained with MADCUBAIJ assuming Tex = 50 K (see text).
Current usage metrics show cumulative count of Article Views (full-text article views including HTML views, PDF and ePub downloads, according to the available data) and Abstracts Views on Vision4Press platform.
Data correspond to usage on the plateform after 2015. The current usage metrics is available 48-96 hours after online publication and is updated daily on week days.
Initial download of the metrics may take a while.