Fig. 8
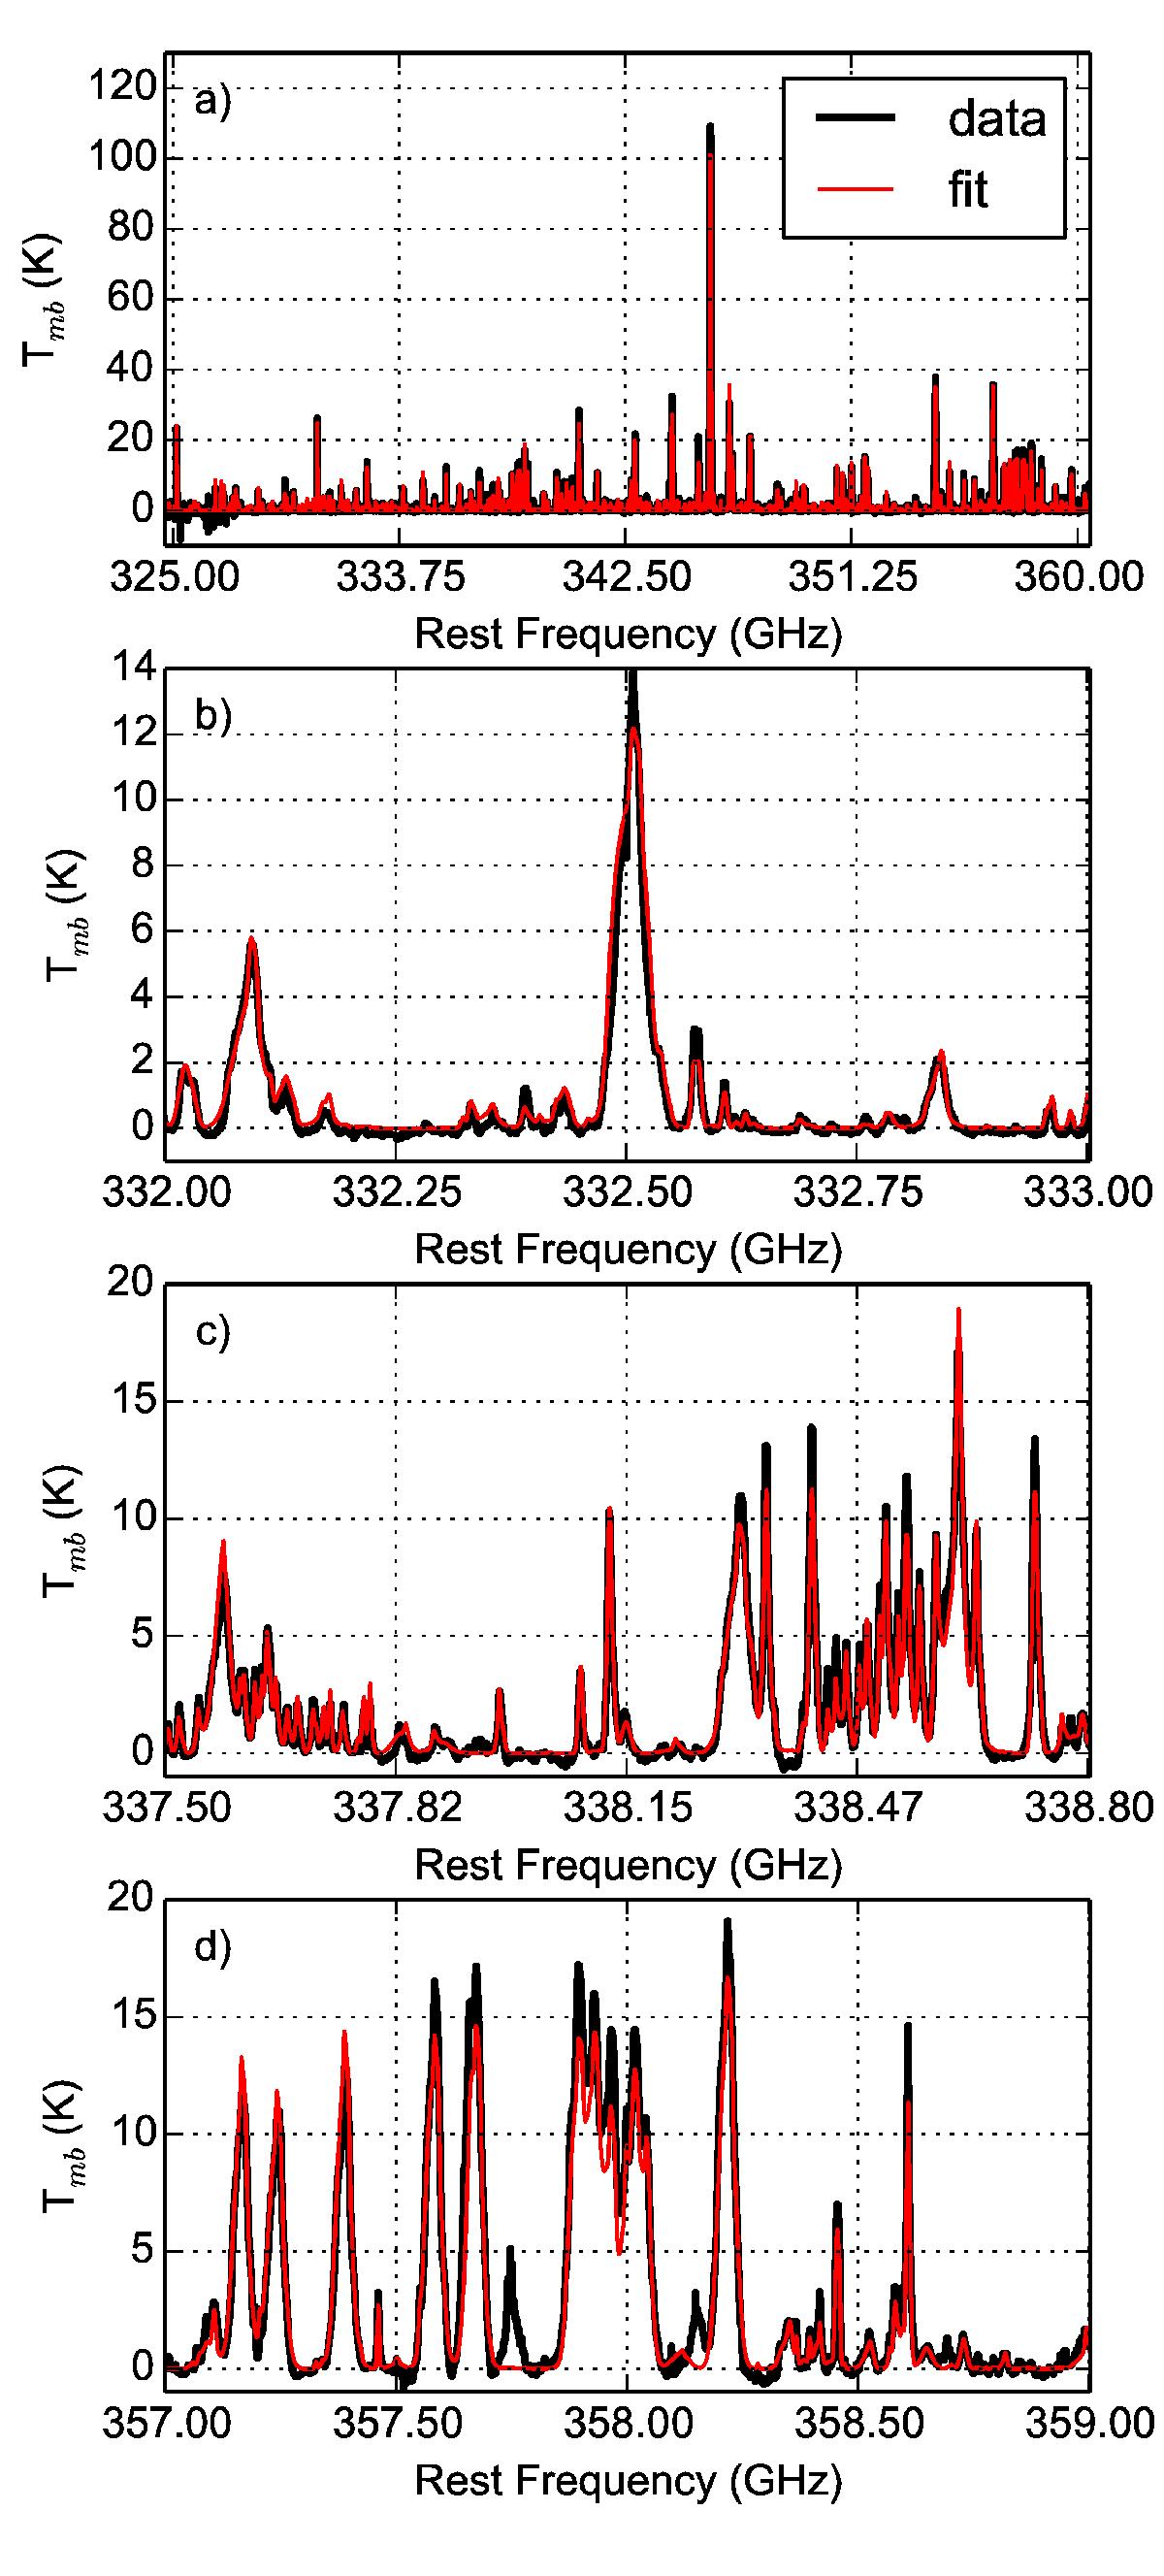
Result of the spectral line survey of the high-mass star-forming region Orion KL between 325 to 360 GHz using the myXCLASSFit function. Here, we used 24 molecules in conjunction with 245 isotopologues. In panel a) the whole spectral line survey (back) is shown together with the result of myXCLASSFit function (red). Panels b), c) and d) show fit examples around 332.5 GHz, 338.15 GHz, and 358.0 GHz, respectively.
Current usage metrics show cumulative count of Article Views (full-text article views including HTML views, PDF and ePub downloads, according to the available data) and Abstracts Views on Vision4Press platform.
Data correspond to usage on the plateform after 2015. The current usage metrics is available 48-96 hours after online publication and is updated daily on week days.
Initial download of the metrics may take a while.