Free Access
Fig. 1
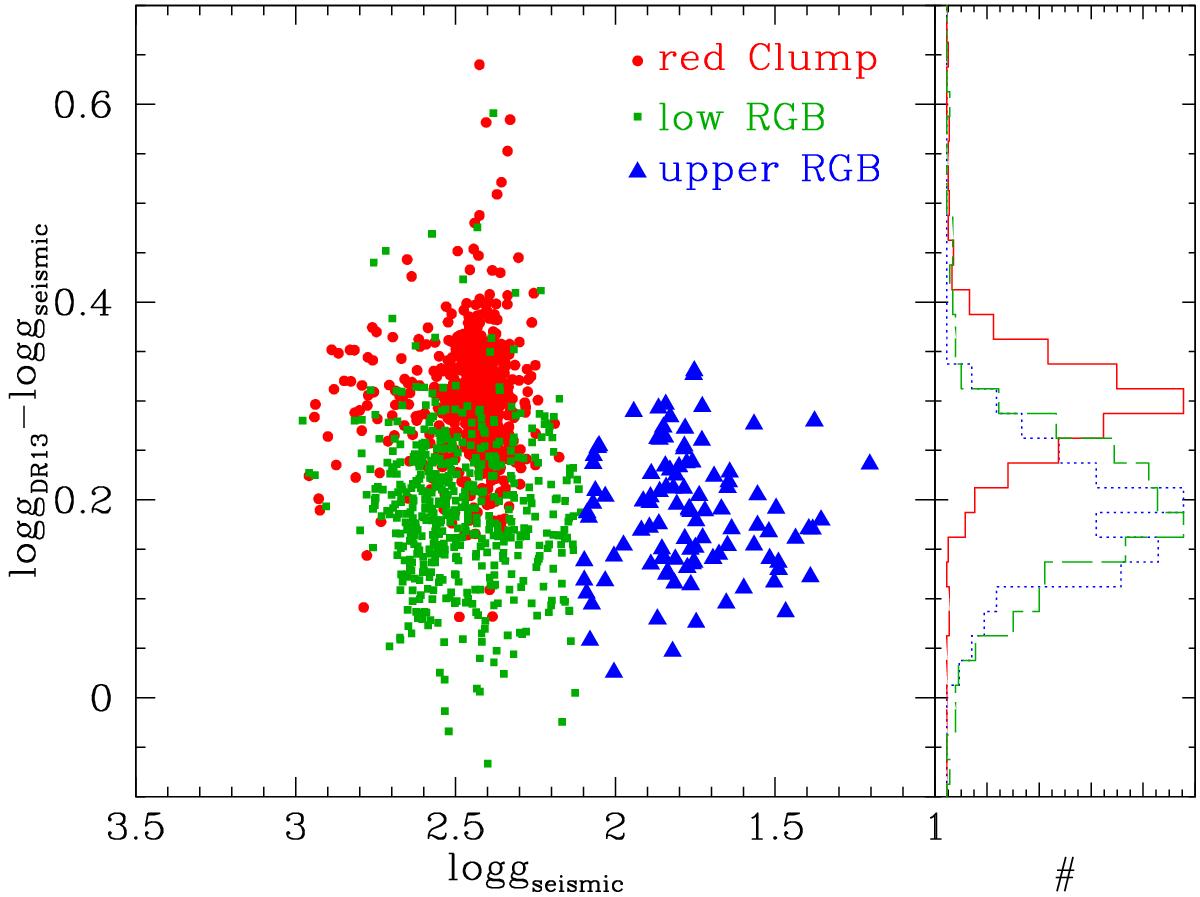
Difference in log g derived in the uncalibrated APOGEE DR13 log g and the log g obtained by asteroseismology. The sample is divided in three categories with three different symbols: RC stars as red points, lower RGB as green squares, and blue triangles as upper RGB.
Current usage metrics show cumulative count of Article Views (full-text article views including HTML views, PDF and ePub downloads, according to the available data) and Abstracts Views on Vision4Press platform.
Data correspond to usage on the plateform after 2015. The current usage metrics is available 48-96 hours after online publication and is updated daily on week days.
Initial download of the metrics may take a while.