Free Access
Fig. 4
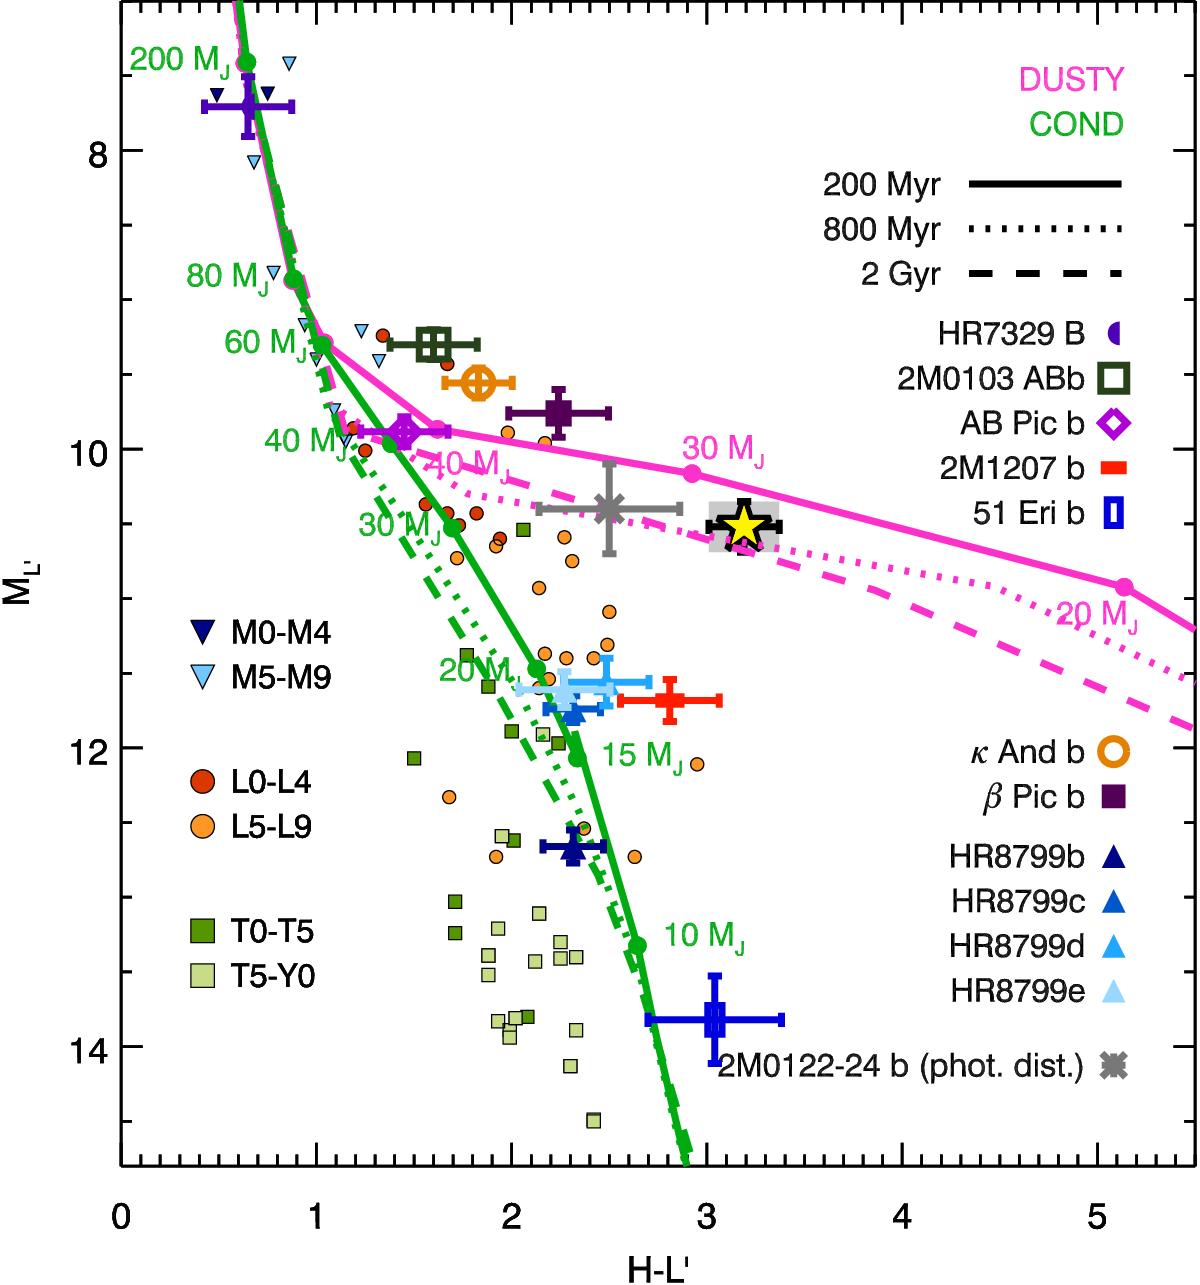
Colour−magnitude diagram, obtained from Galicher et al. (2014) with the new photometry of HD 206893 B (yellow star), that of 51 Eri (Macintosh et al. 2015) and 2MASS 0122-2439 B (Bowler et al. 2013). The lines show the isochrones for different ages and evolution models.
Current usage metrics show cumulative count of Article Views (full-text article views including HTML views, PDF and ePub downloads, according to the available data) and Abstracts Views on Vision4Press platform.
Data correspond to usage on the plateform after 2015. The current usage metrics is available 48-96 hours after online publication and is updated daily on week days.
Initial download of the metrics may take a while.