Free Access
Fig. 6
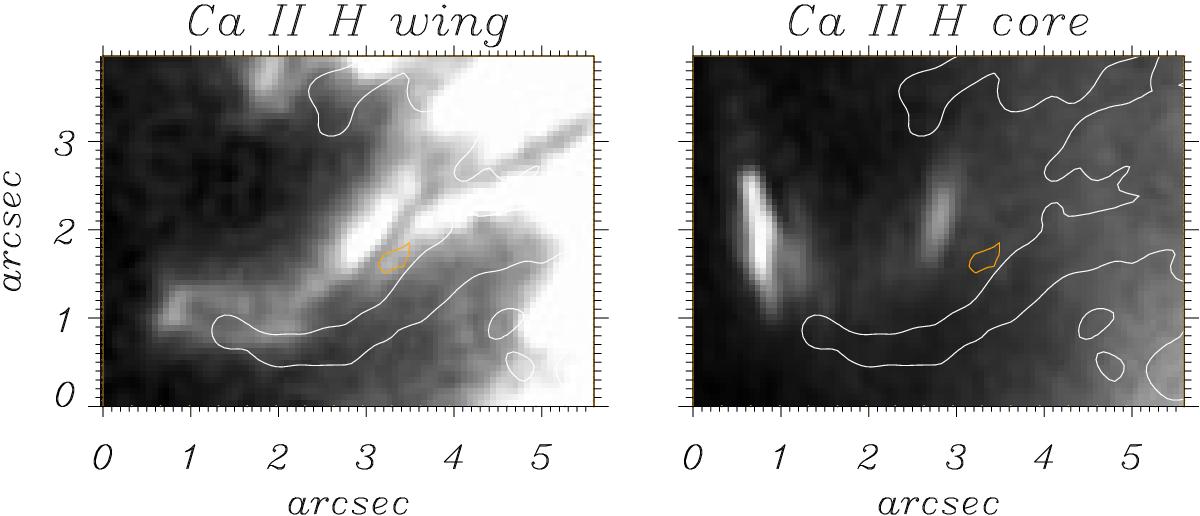
Left: Ca II H wing image. An intensity threshold has been chosen to highlight the penumbral intrusion. Right: Ca II H core image. The white contours correspond to a continuum (6302 Å) threshold, the orange contour outlines the opposite polarity patch. All images were recorded around 08:44:55 UT.
Current usage metrics show cumulative count of Article Views (full-text article views including HTML views, PDF and ePub downloads, according to the available data) and Abstracts Views on Vision4Press platform.
Data correspond to usage on the plateform after 2015. The current usage metrics is available 48-96 hours after online publication and is updated daily on week days.
Initial download of the metrics may take a while.