Fig. 9
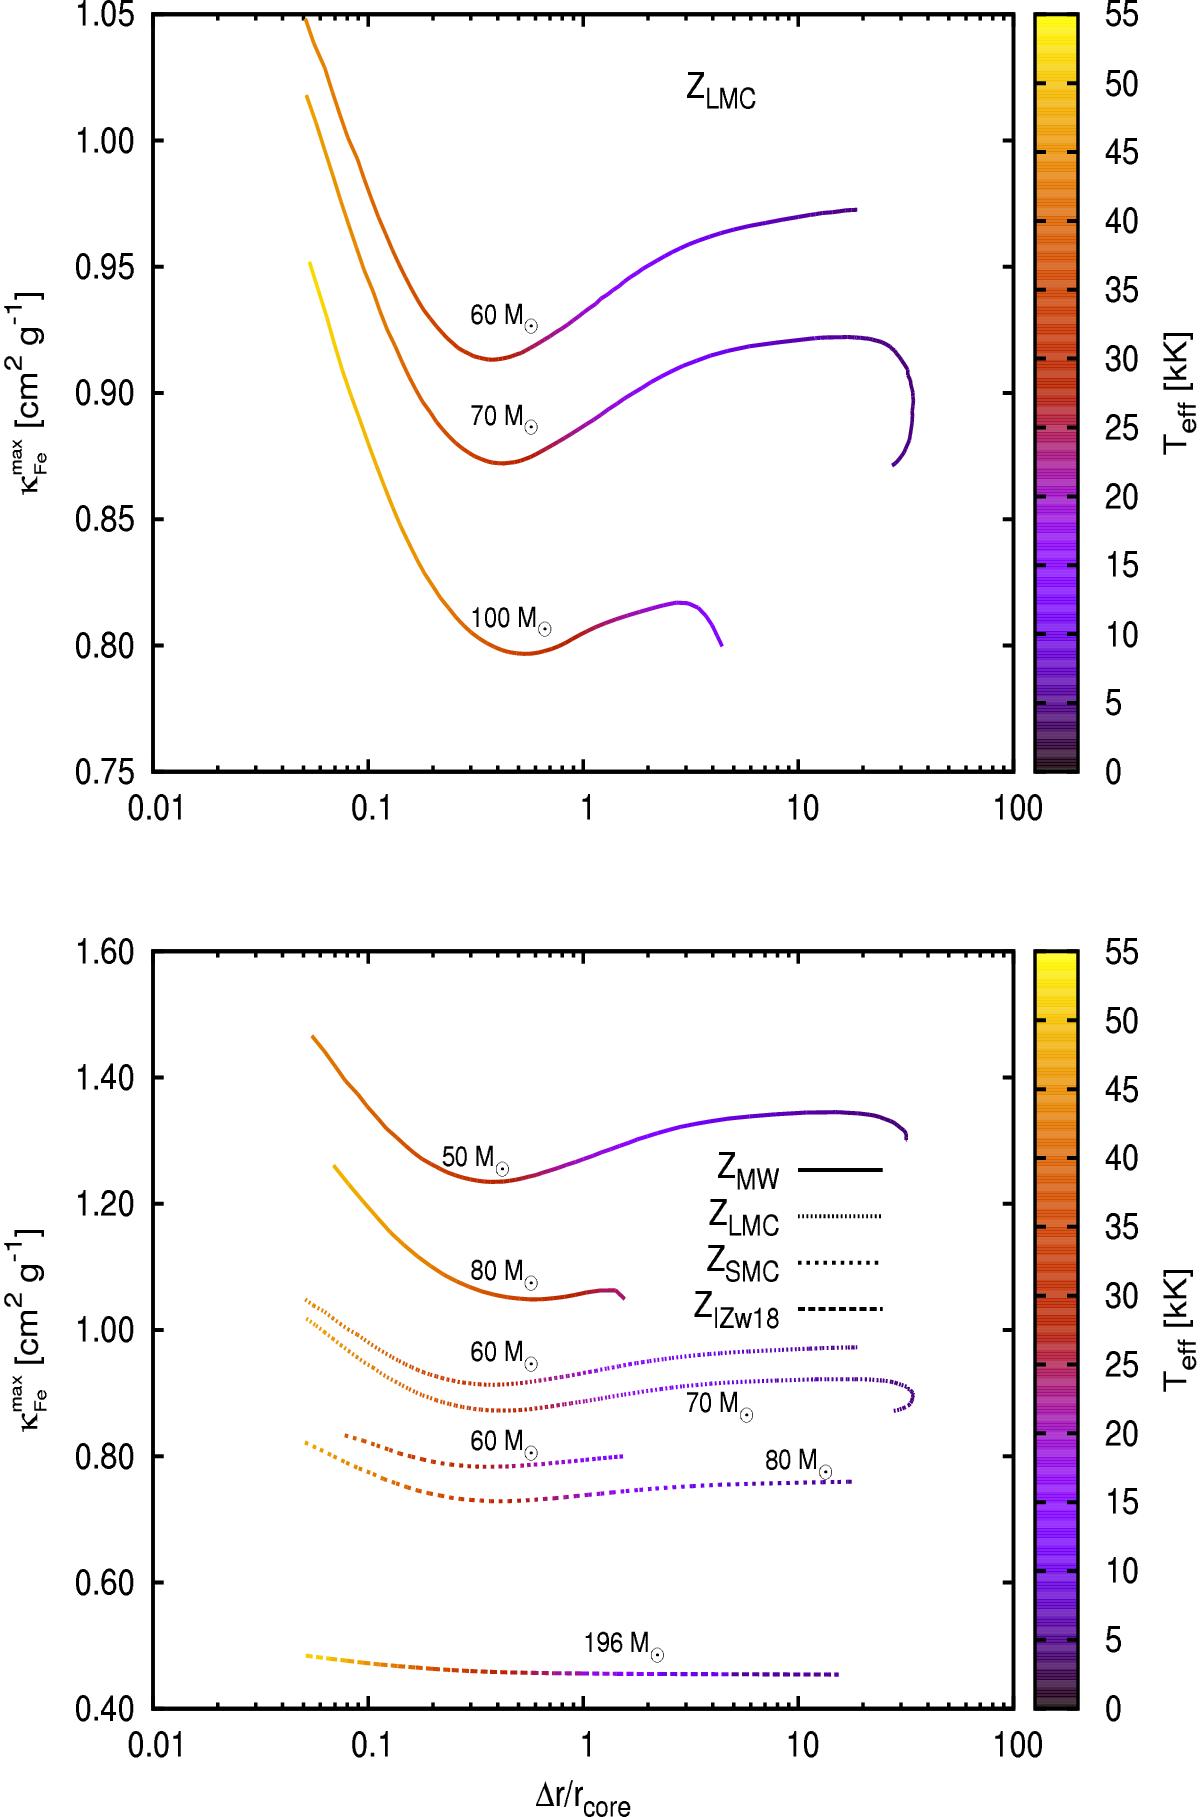
Top: maximum opacity within the Fe-bump region for three different evolutionary sequences with initial masses of 60,70, and 100 M⊙ from the LMC grid as a function of Δr/rcore. The effective temperature of the model is colour coded. Only the part of the evolution where Ys< 0.3 has been plotted. Bottom: same as in the top panel, but for four metallicities.
Current usage metrics show cumulative count of Article Views (full-text article views including HTML views, PDF and ePub downloads, according to the available data) and Abstracts Views on Vision4Press platform.
Data correspond to usage on the plateform after 2015. The current usage metrics is available 48-96 hours after online publication and is updated daily on week days.
Initial download of the metrics may take a while.