Fig. 5
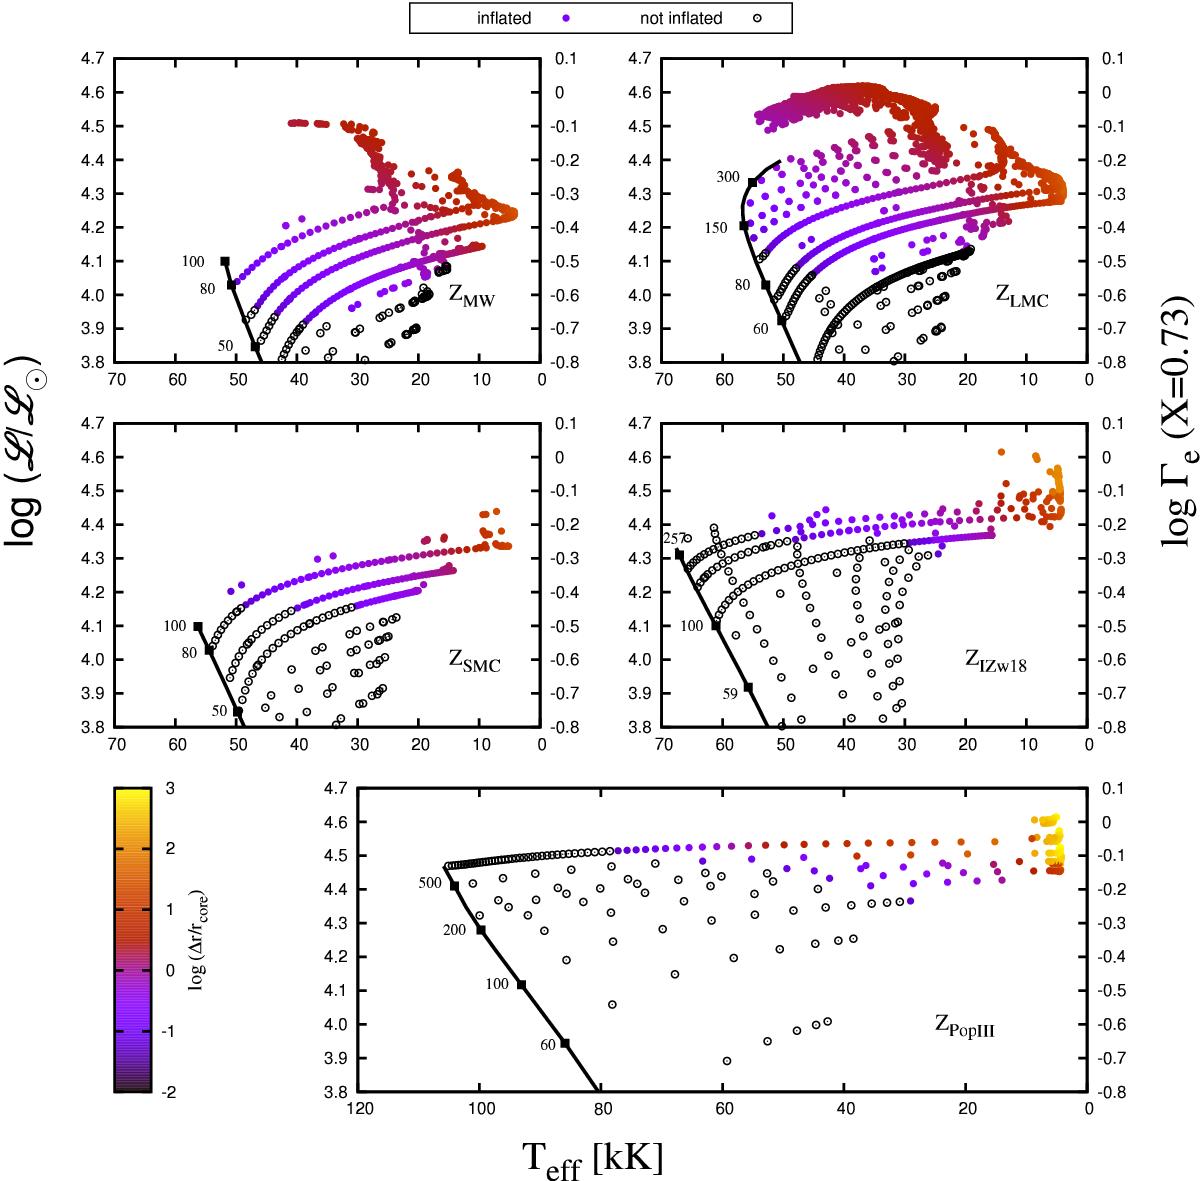
Spectroscopic HR diagram showing the metallicity dependence of inflation for the analysed models in our grid. The left Y-axis shows the quantity log (L/ L⊙), whereas the right Y-axis shows the corresponding values of log (Γe). The Γe values are computed assuming a solar hydrogen abundance (completely ionised). Models marked with open black dots are not inflated, whereas the coloured dots represent models with inflated envelopes. The colour of the dots indicates the strength of inflation, log (Δr/rcore ). The black line is the ZAMS, and the masses of some representative models (in units of M⊙) are indicated along it.
Current usage metrics show cumulative count of Article Views (full-text article views including HTML views, PDF and ePub downloads, according to the available data) and Abstracts Views on Vision4Press platform.
Data correspond to usage on the plateform after 2015. The current usage metrics is available 48-96 hours after online publication and is updated daily on week days.
Initial download of the metrics may take a while.