Fig. 2
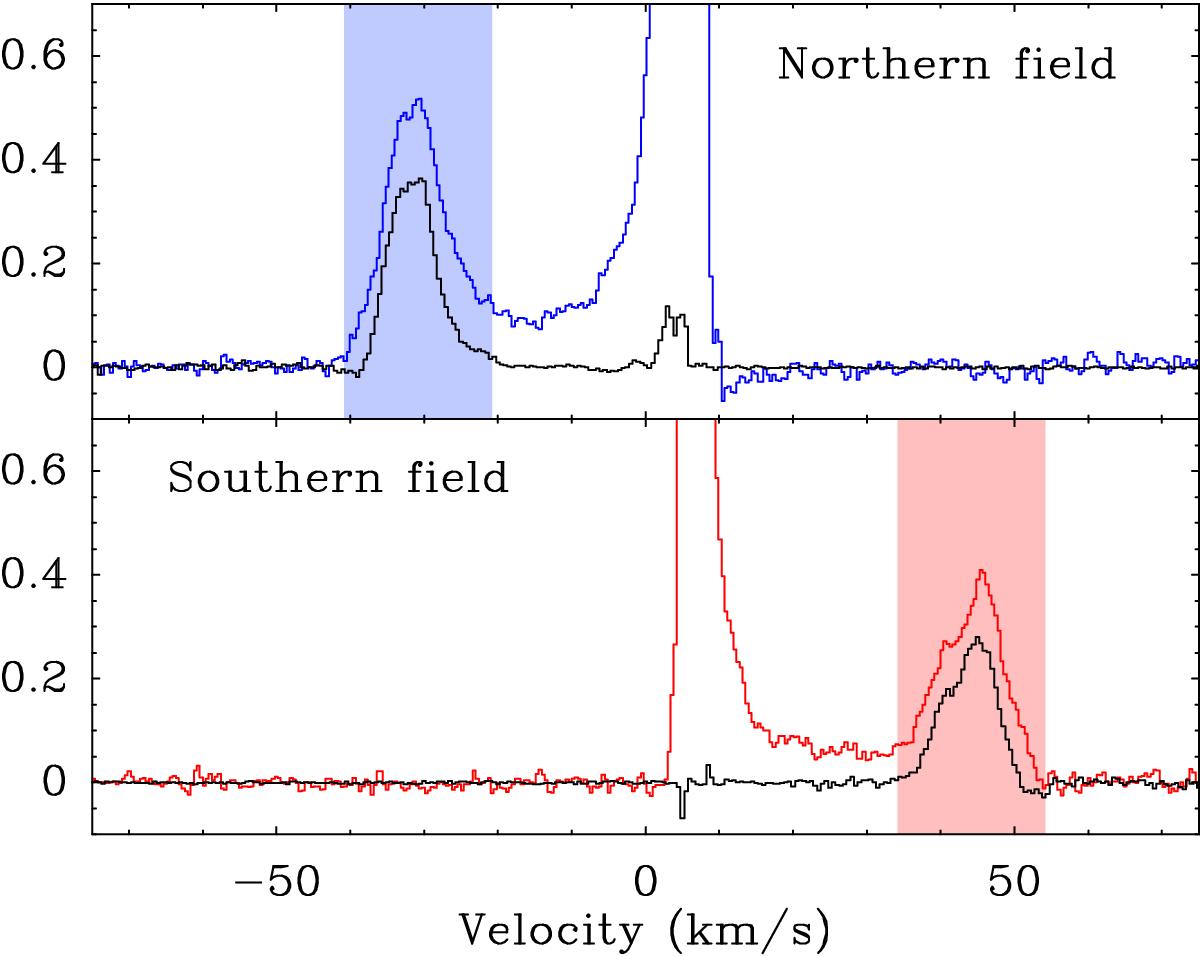
Comparison between the IRAM 30 m single dish spectra from T04 (blue and red histograms) and ALMA spectra synthesized for the same positions and angular resolution (11′′). The color vertical bands indicate the location of the blue and red EHV regimes. There is a good agreement between the 30 m and ALMA spectra inside the EHV ranges, which is indicative of only minor missing flux. IRAM 30 m data in Tmb scale and ALMA data in TB scale.
Current usage metrics show cumulative count of Article Views (full-text article views including HTML views, PDF and ePub downloads, according to the available data) and Abstracts Views on Vision4Press platform.
Data correspond to usage on the plateform after 2015. The current usage metrics is available 48-96 hours after online publication and is updated daily on week days.
Initial download of the metrics may take a while.