Free Access
Fig. 7
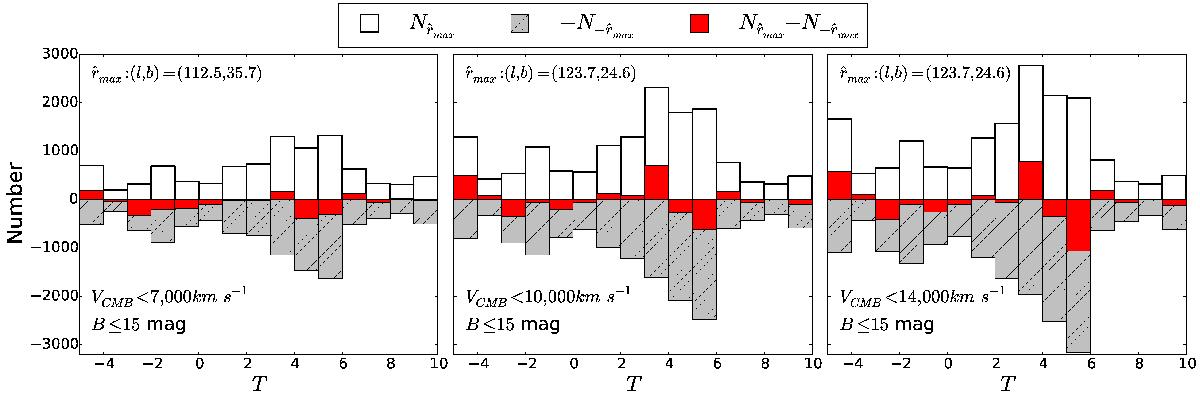
Distribution of morphologies in the hemispheres towards ![]() (positive numbers) and
(positive numbers) and ![]() (negative numbers) for the samples with B ≤ 15 mag, from left to right corresponding to VCMB< 7000, 10 000, and 14 000 km s-1. The number difference between the two hemispheres for each T is shown by red bars.
(negative numbers) for the samples with B ≤ 15 mag, from left to right corresponding to VCMB< 7000, 10 000, and 14 000 km s-1. The number difference between the two hemispheres for each T is shown by red bars.
Current usage metrics show cumulative count of Article Views (full-text article views including HTML views, PDF and ePub downloads, according to the available data) and Abstracts Views on Vision4Press platform.
Data correspond to usage on the plateform after 2015. The current usage metrics is available 48-96 hours after online publication and is updated daily on week days.
Initial download of the metrics may take a while.