Fig. 6
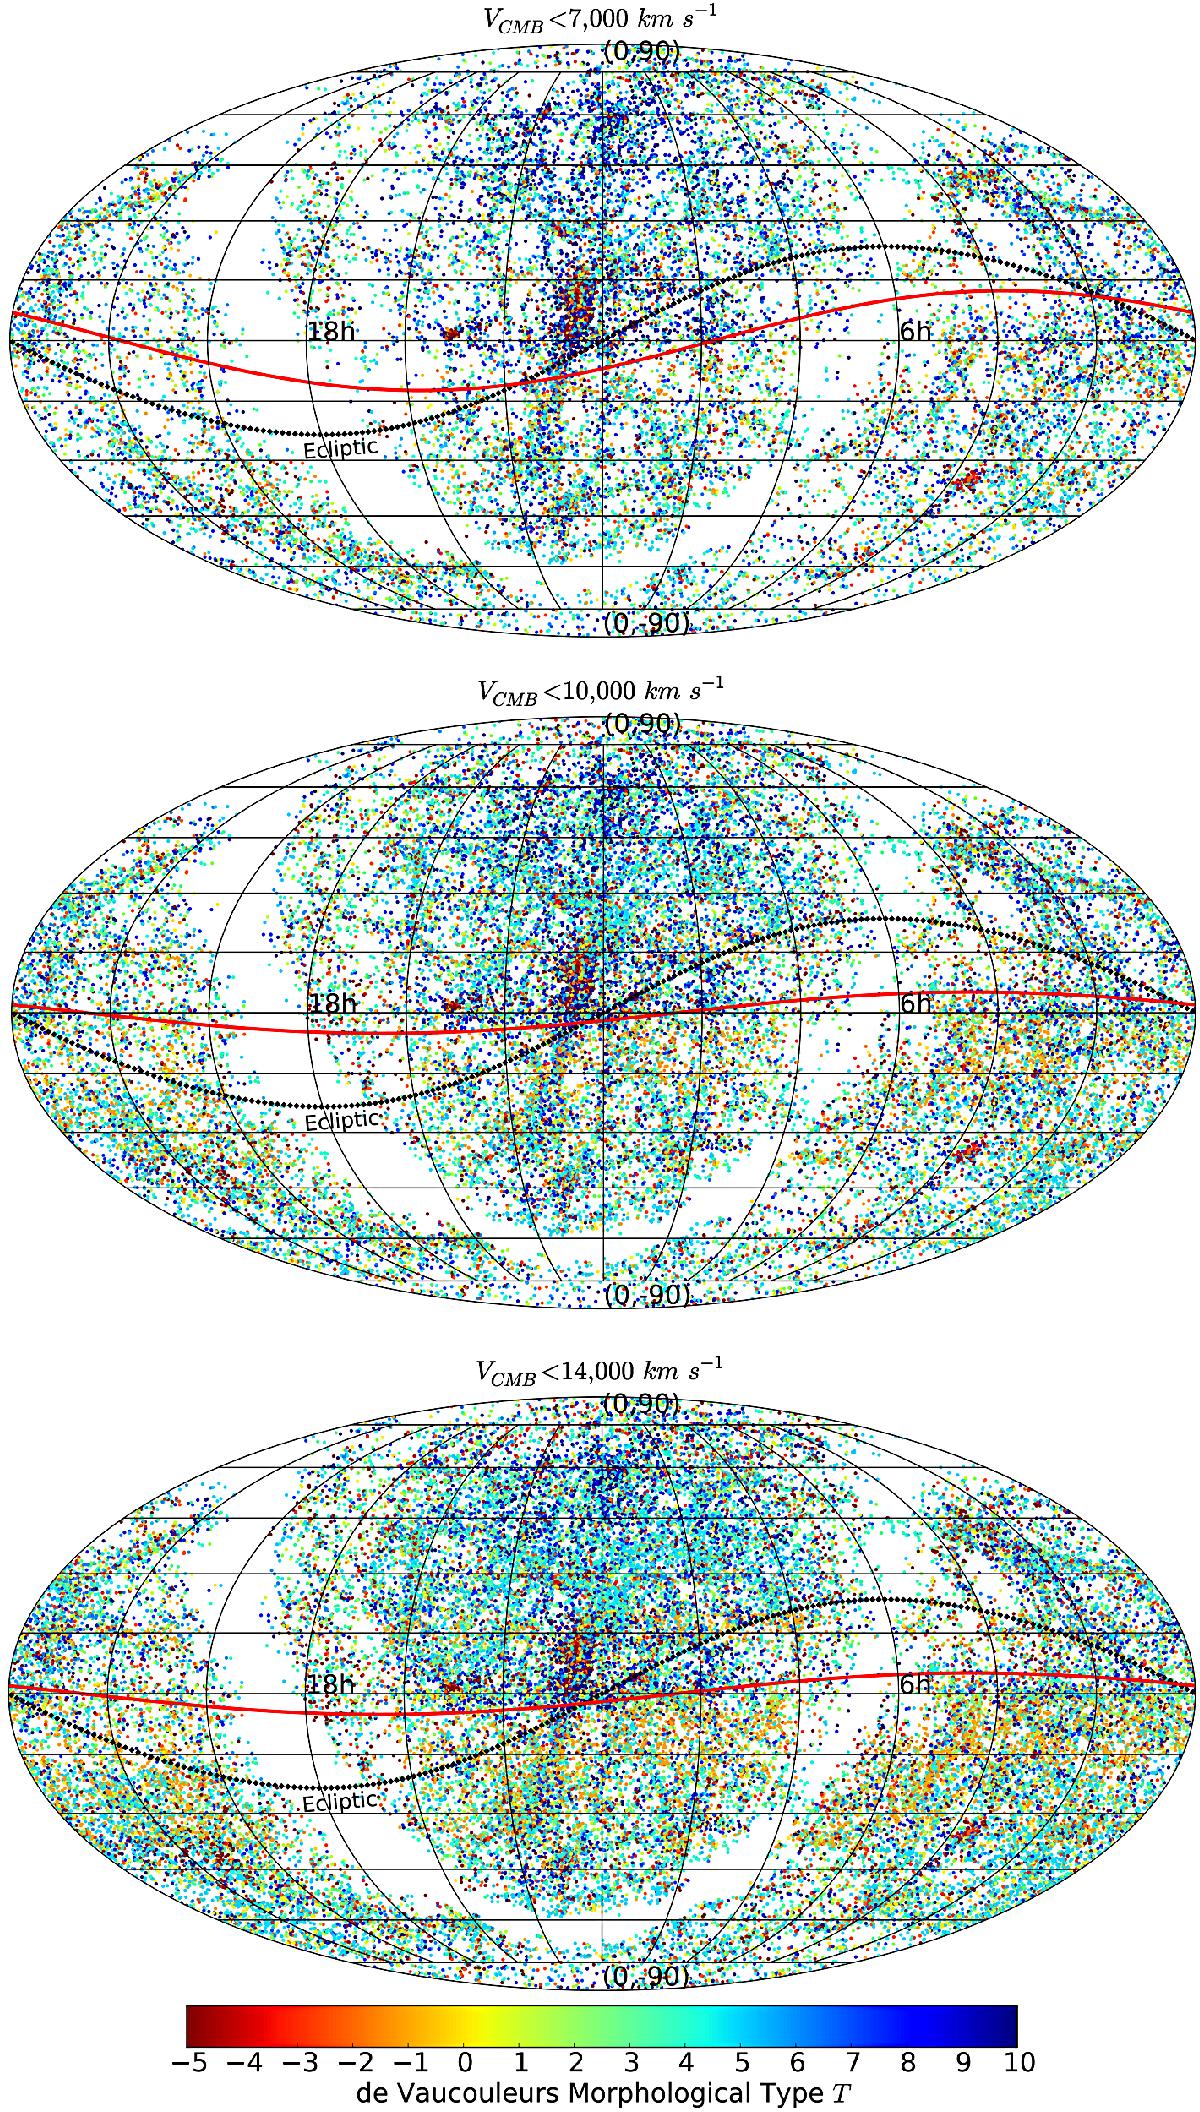
Equatorial coordinate system distribution of all the galaxies in the HyperLeda database with measured T and MB, from top to bottom corresponding to VCMB< 7000, 10 000, and 14 000 km s-1. The color code is T, the empty parts are the region around the disk of the Milky Way, the plane of the ecliptic is shown with a dotted line, and the pair of hemispheres with the greatest difference in the distribution of morphologies are divided by a red solid line.
Current usage metrics show cumulative count of Article Views (full-text article views including HTML views, PDF and ePub downloads, according to the available data) and Abstracts Views on Vision4Press platform.
Data correspond to usage on the plateform after 2015. The current usage metrics is available 48-96 hours after online publication and is updated daily on week days.
Initial download of the metrics may take a while.