Free Access
Fig. 5
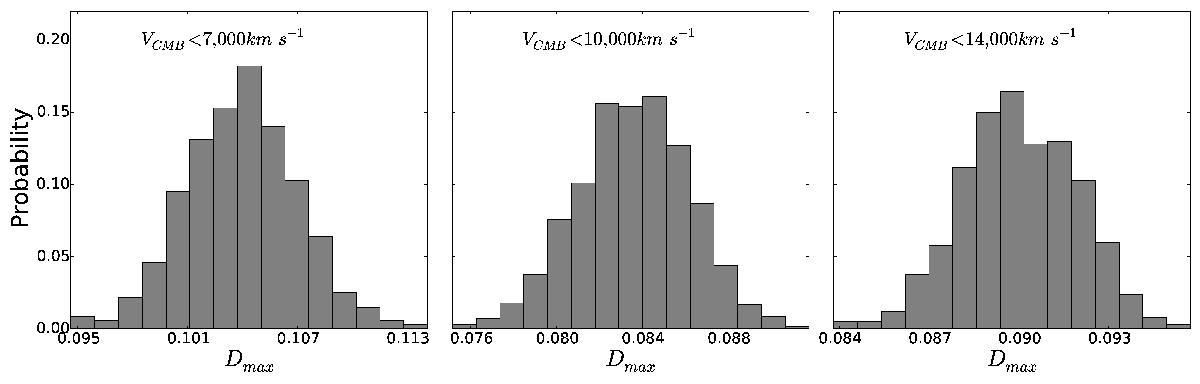
The probability distribution of Dmax for 1000 realizations in which Ti of each galaxy is replaced by Ti + ΔT where ΔT is randomly drawn from a Gaussian distribution with zero mean and standard deviation σTi. From left to right for VCMB< 7000, 10 000 and 14 000 km s-1, respectively. See Sect. 4.4.
Current usage metrics show cumulative count of Article Views (full-text article views including HTML views, PDF and ePub downloads, according to the available data) and Abstracts Views on Vision4Press platform.
Data correspond to usage on the plateform after 2015. The current usage metrics is available 48-96 hours after online publication and is updated daily on week days.
Initial download of the metrics may take a while.