Fig. 4
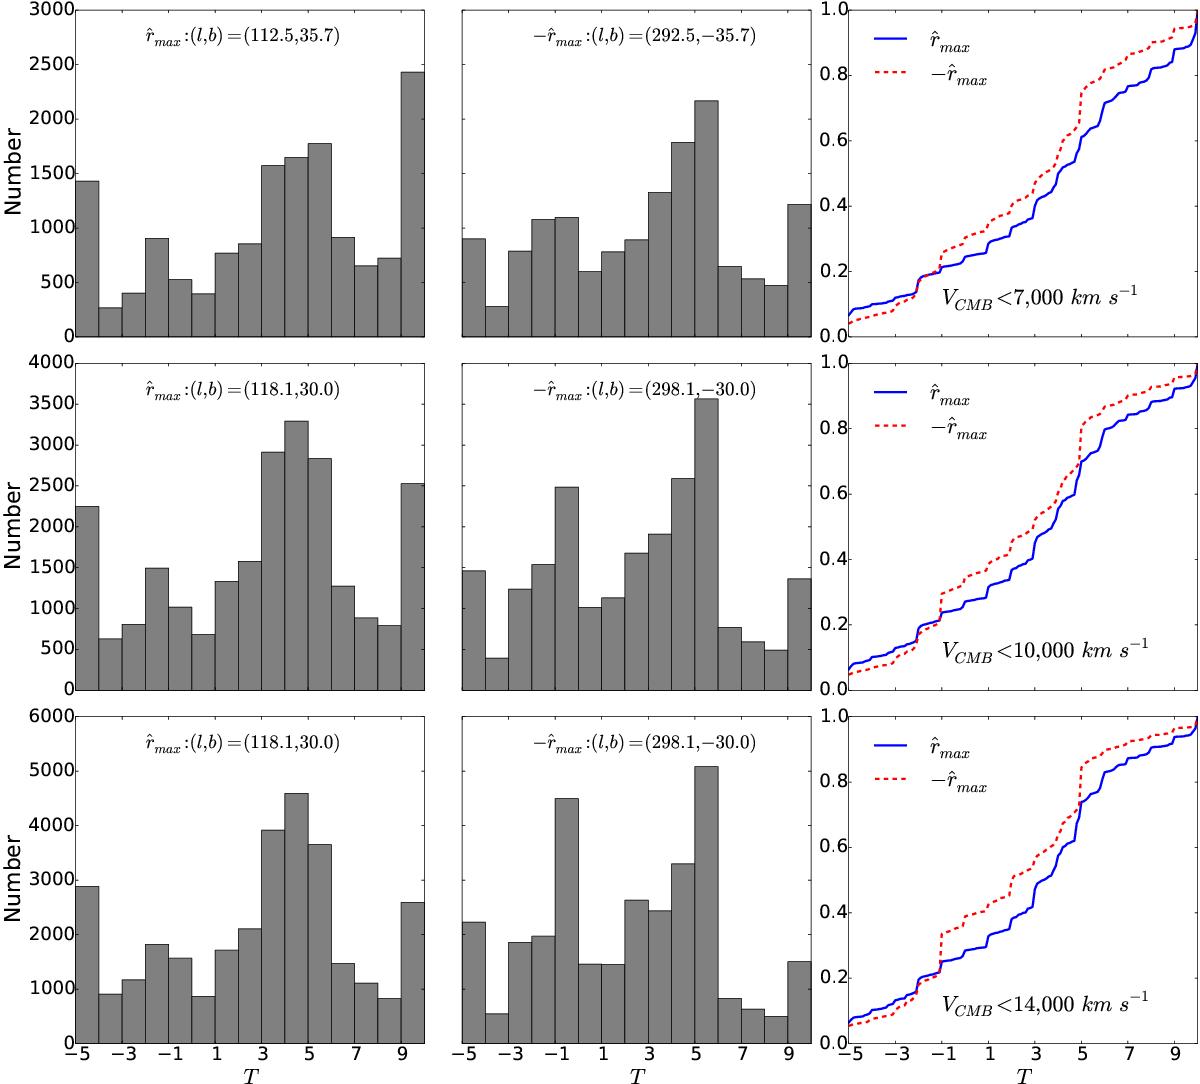
Distribution of morphologies in the hemisphere pairs with the greatest difference, i.e., towards ![]() and
and ![]() , in the first and second columns and their corresponding cumulative distributions in the third column from top to bottom for VCMB < 7000, 10 000, and 14 000 km s-1. The prominent differences are at 9 ≤ T ≤ 10 and −1 ≤ T< 0.
, in the first and second columns and their corresponding cumulative distributions in the third column from top to bottom for VCMB < 7000, 10 000, and 14 000 km s-1. The prominent differences are at 9 ≤ T ≤ 10 and −1 ≤ T< 0.
Current usage metrics show cumulative count of Article Views (full-text article views including HTML views, PDF and ePub downloads, according to the available data) and Abstracts Views on Vision4Press platform.
Data correspond to usage on the plateform after 2015. The current usage metrics is available 48-96 hours after online publication and is updated daily on week days.
Initial download of the metrics may take a while.