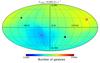
Fig. 3
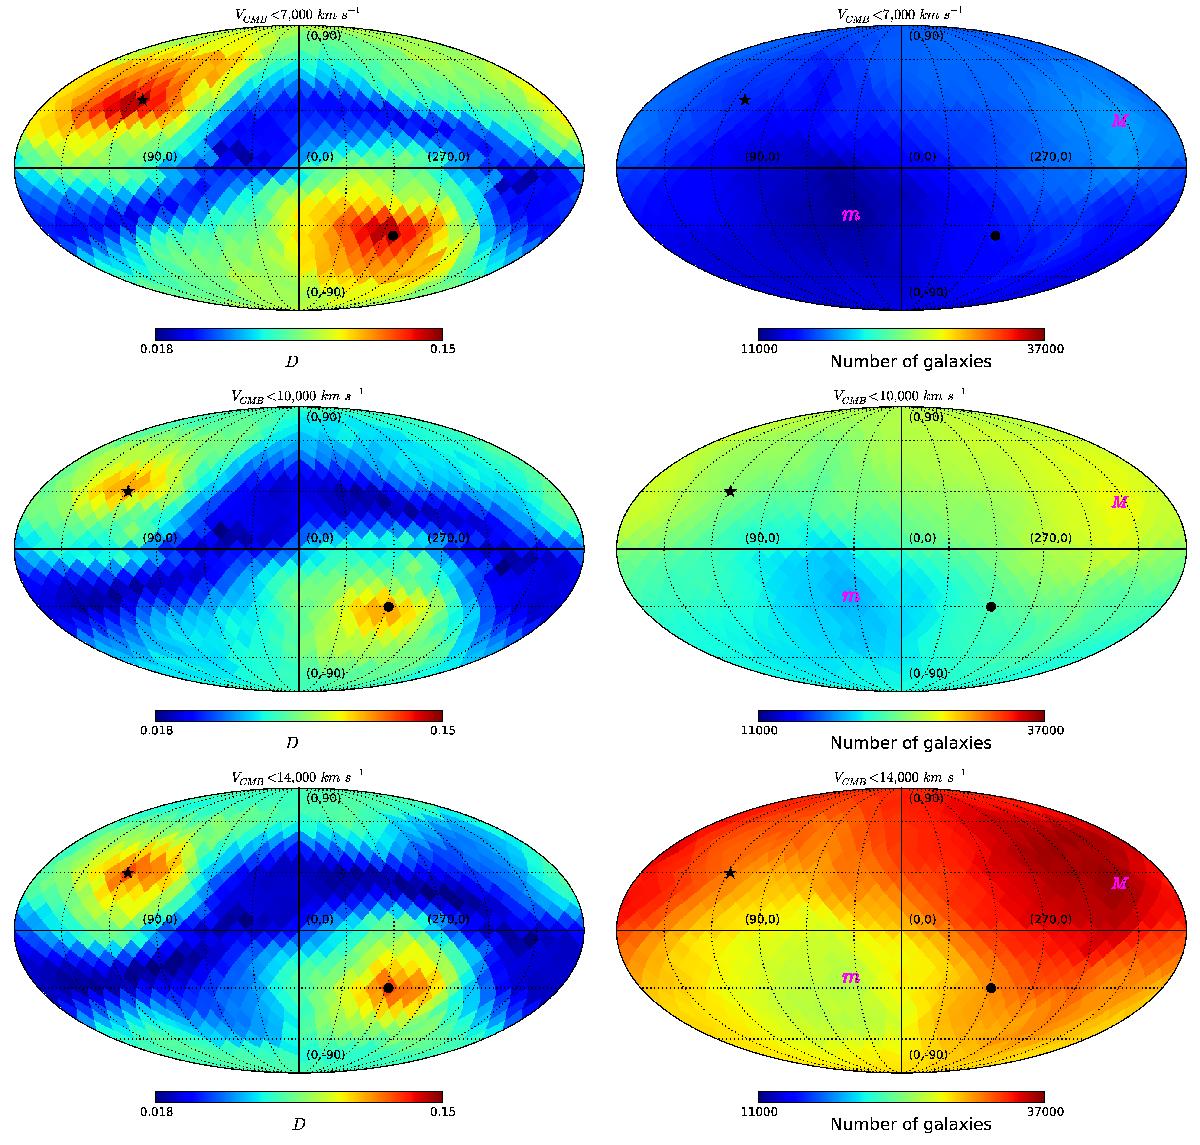
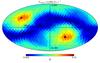
Left: sky maps of D from the KS test in the Galactic coordinate system from top to bottom for VCMB < 7000, 10 000, and 14 000 km s-1. The value in each pixel is obtained from the KS comparison of the pair of hemispheres with axis of symmetry along the center of that pixel. The opposite direction of each pixel has exactly the same value. On each map, the direction ![]() is marked by a star and its opposite direction,
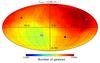
is marked by a star and its opposite direction, ![]() , by a circle. Right: variation in the number of galaxies in each sample across the sky, also in the Galactic coordinate system. The value of each pixel is the number of galaxies in a hemisphere whose pole is pointing towards that pixel. The directions with the minimum and the maximum number are denoted by small m and capital M, respectively. We see that the directions with the greatest difference in the distribution of morphologies are very different from those with the greatest difference in the number of galaxies (see Sect. 4.1).
, by a circle. Right: variation in the number of galaxies in each sample across the sky, also in the Galactic coordinate system. The value of each pixel is the number of galaxies in a hemisphere whose pole is pointing towards that pixel. The directions with the minimum and the maximum number are denoted by small m and capital M, respectively. We see that the directions with the greatest difference in the distribution of morphologies are very different from those with the greatest difference in the number of galaxies (see Sect. 4.1).
Current usage metrics show cumulative count of Article Views (full-text article views including HTML views, PDF and ePub downloads, according to the available data) and Abstracts Views on Vision4Press platform.
Data correspond to usage on the plateform after 2015. The current usage metrics is available 48-96 hours after online publication and is updated daily on week days.
Initial download of the metrics may take a while.