Fig. 1
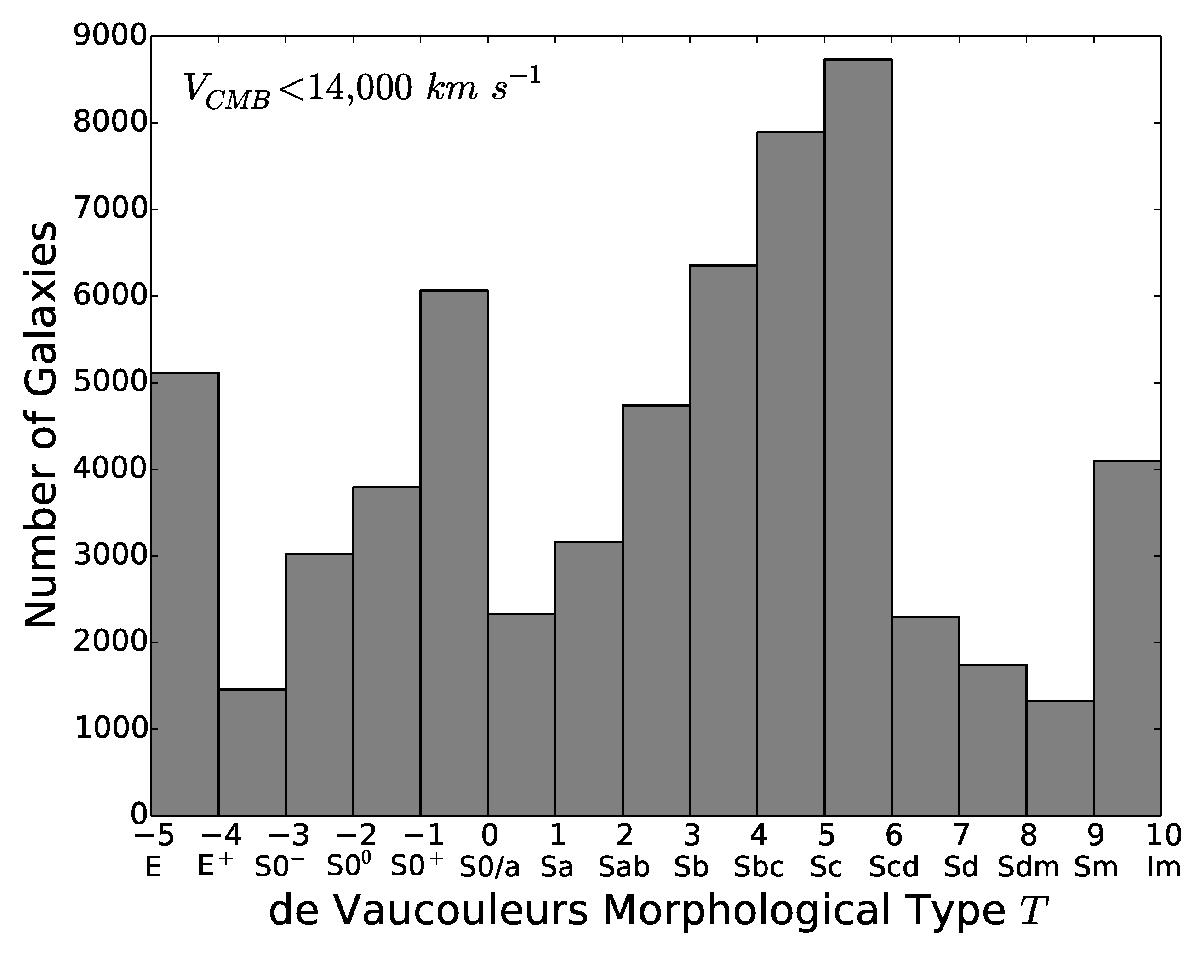
Number distribution of the T values for the galaxies in the HyperLeda database with VCMB< 14 000 km s-1 and a measured MB. In all the bins only the left edge is included in the counting (e.g., for the the first bin −5 ≤ T< 4) except for the last bin, which also includes the right edge (i.e., 9 ≤ T ≤ 10). This is the same for the rest of the histogram plots in this paper.
Current usage metrics show cumulative count of Article Views (full-text article views including HTML views, PDF and ePub downloads, according to the available data) and Abstracts Views on Vision4Press platform.
Data correspond to usage on the plateform after 2015. The current usage metrics is available 48-96 hours after online publication and is updated daily on week days.
Initial download of the metrics may take a while.