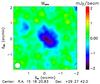
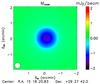
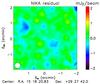
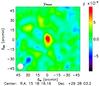
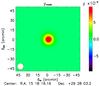
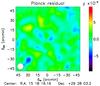
Fig. 9
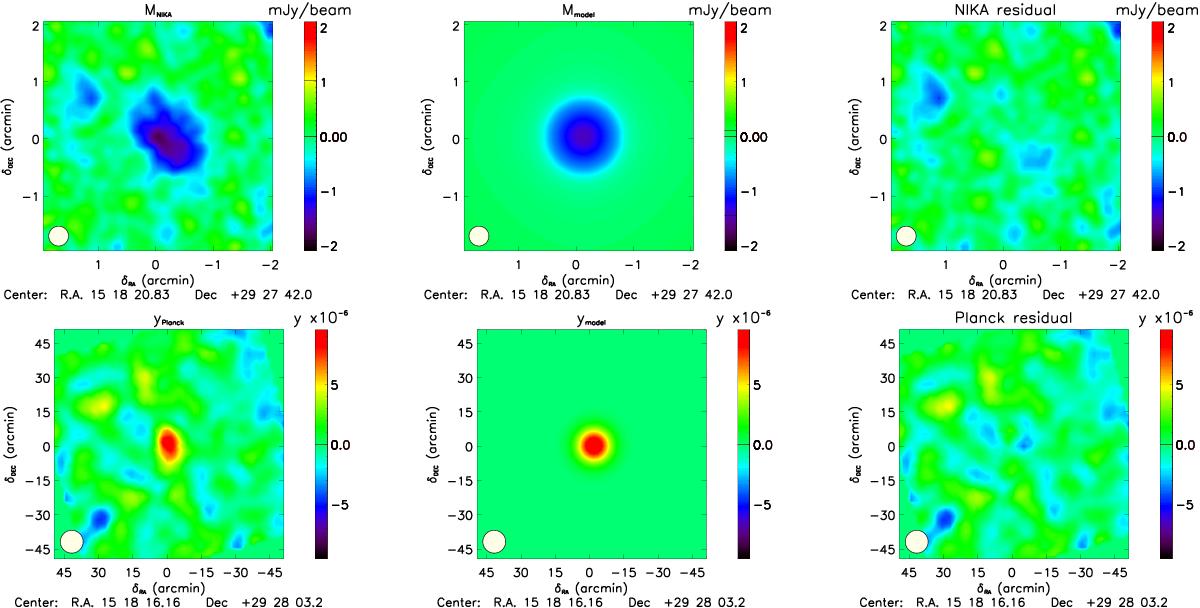
NIKA tSZ surface brightness at 150 GHz, maximum likelihood tSZ map and residual (top row) and Planck Compton parameter map, maximum likelihood Compton parameter map and residual (bottom row) computed from a non-parametric model based MCMC analysis. The residual maps does not indicate any significant substructure since no S/N over 3 is observed. The NIKA beam at 150 GHz and the Planck effective beam of 10 arcmin FWHM are shown in the bottom left-hand corner of the top and bottom row maps, respectively.
Current usage metrics show cumulative count of Article Views (full-text article views including HTML views, PDF and ePub downloads, according to the available data) and Abstracts Views on Vision4Press platform.
Data correspond to usage on the plateform after 2015. The current usage metrics is available 48-96 hours after online publication and is updated daily on week days.
Initial download of the metrics may take a while.