Fig. 5
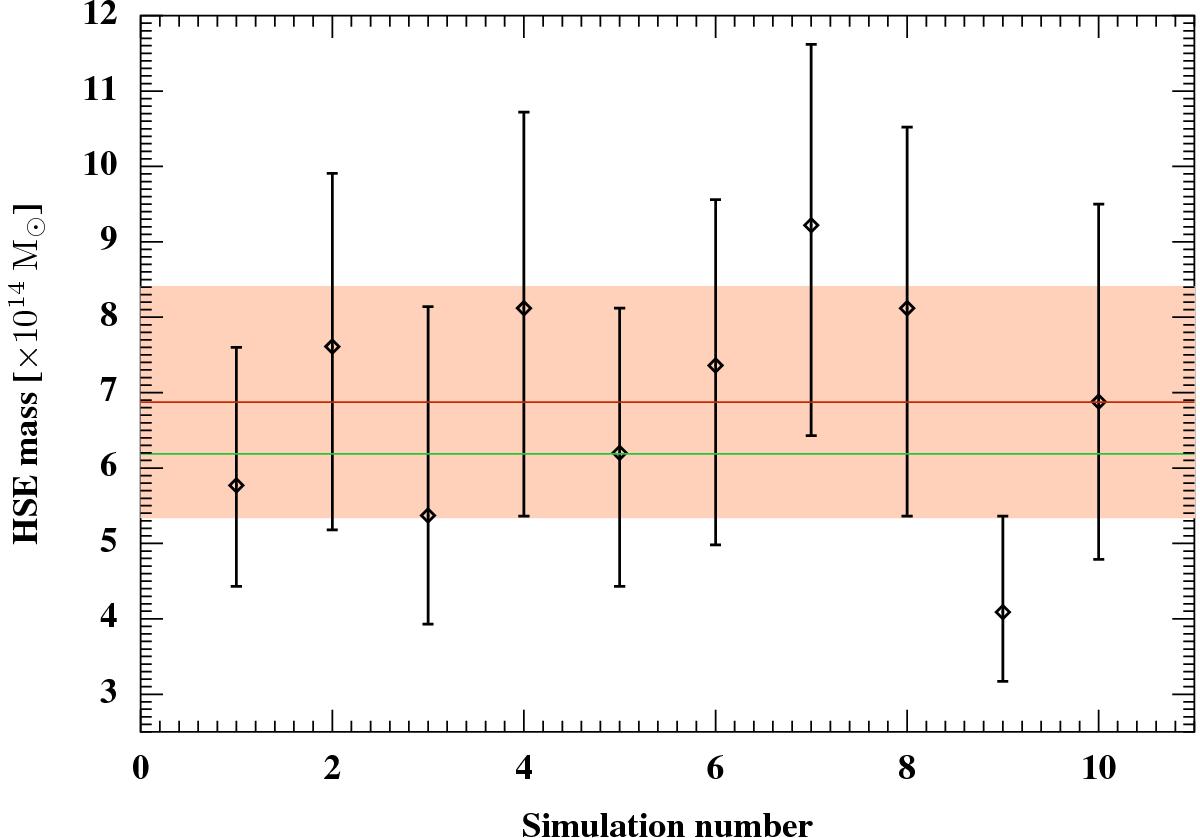
Mass estimates (black diamonds) for the simulated triaxial clusters with their major axis orthogonal to the line of sight. The red line indicates the mean of the recovered distribution and the salmon region is its dispersion. The input mass given by the gNFW and SVM models considered for the simulation is represented by the green line.
Current usage metrics show cumulative count of Article Views (full-text article views including HTML views, PDF and ePub downloads, according to the available data) and Abstracts Views on Vision4Press platform.
Data correspond to usage on the plateform after 2015. The current usage metrics is available 48-96 hours after online publication and is updated daily on week days.
Initial download of the metrics may take a while.