Fig. 4
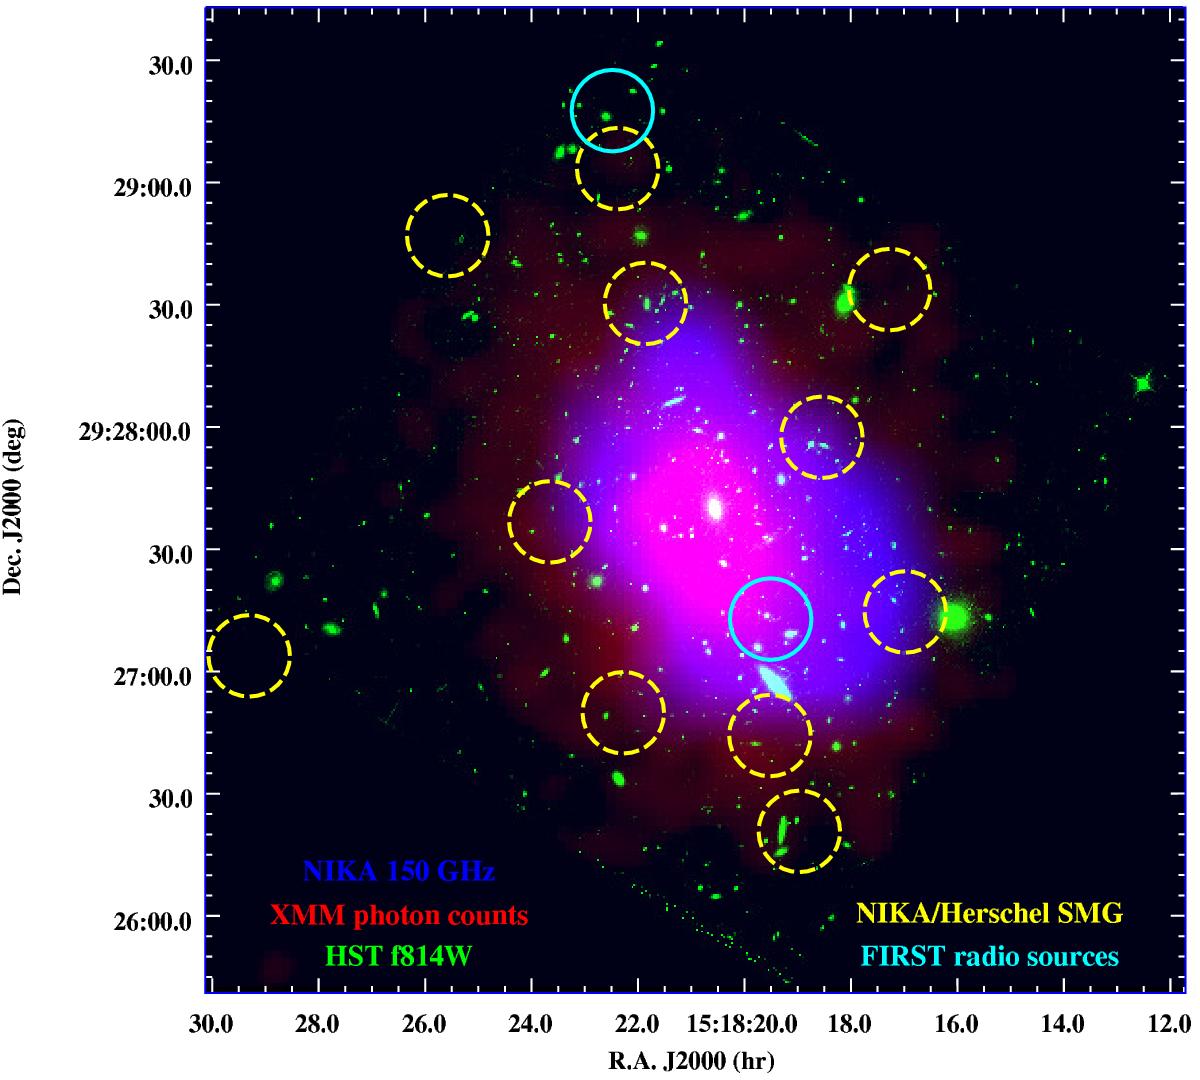
Multiprobe combined map of PSZ1 G045.85+57.71. Blue: NIKA tSZ surface brightness map giving an estimate of the ICM pressure distribution. Red: XMM-Newton X-ray photon count map tracing the electronic density squared. Green: Hubble Space Telescope image of the cluster using the F814W filter and showing the cluster galaxy locations. The solid cyan and dashed yellow circles give respectively the radio and submillimeter point sources identified in the field of view.
Current usage metrics show cumulative count of Article Views (full-text article views including HTML views, PDF and ePub downloads, according to the available data) and Abstracts Views on Vision4Press platform.
Data correspond to usage on the plateform after 2015. The current usage metrics is available 48-96 hours after online publication and is updated daily on week days.
Initial download of the metrics may take a while.