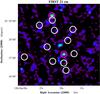
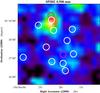
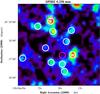
Fig. 3
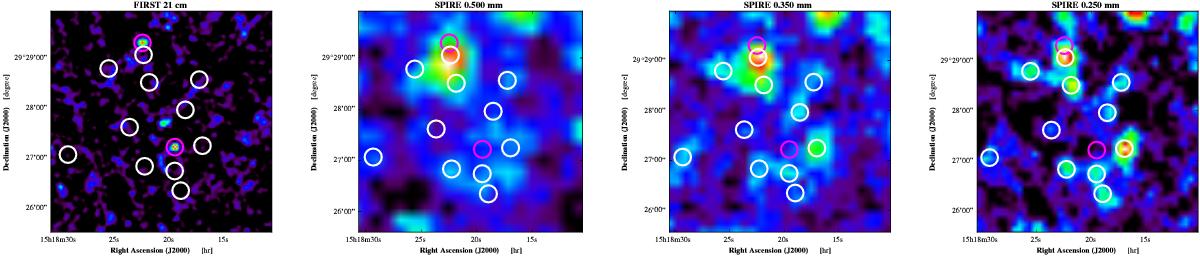
Multiwavelength data set of PSZ1 G045.85+57.71 sky region (the displayed region is 4.4 arcmin wide). The considered instrument is indicated on the top of each map. The maps are smoothed and their range is adapted for visualization purposes. The 10 arcsec radius circles show the point source locations, in magenta for radio sources (Table 2) and in white for submillimeter sources (Table 4).
Current usage metrics show cumulative count of Article Views (full-text article views including HTML views, PDF and ePub downloads, according to the available data) and Abstracts Views on Vision4Press platform.
Data correspond to usage on the plateform after 2015. The current usage metrics is available 48-96 hours after online publication and is updated daily on week days.
Initial download of the metrics may take a while.