Fig. 10
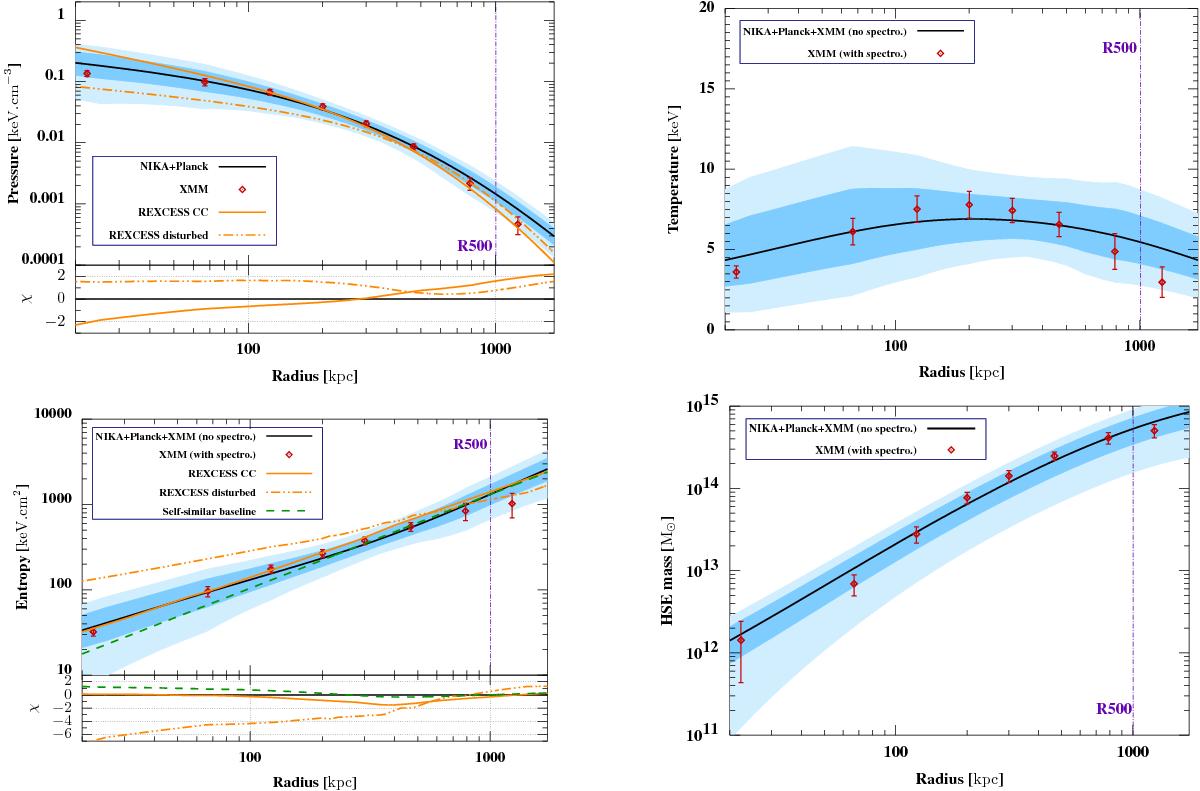
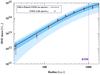
MCMC constraints on the deprojected radial profiles of the pressure (top left), temperature (top right), entropy (bottom left), and hydrostatic mass (bottom right) based on the non-parametric method. The XMM-Newton only measurements are indicated with red dots. The dark and light blue regions show the 68% and 95% confidence limit on the NIKA/Planck estimated profiles, whose best fit is indicated by the black line. The pressure (Arnaud et al. 2010) and entropy (Pratt et al. 2010) mean profiles of both cool-core (orange solid line) and morphologically disturbed (orange dashed line) clusters based on a representative sample of nearby X-ray clusters is also shown. The weighted difference between these mean profiles and the NIKA/Planck estimated profile is shown in the bottom part of both pressure and entropy panels. For the entropy profile, the self-similar expectation computed from non-radiative simulations (Voit et al. 2005) is also represented as a green dashed line.
Current usage metrics show cumulative count of Article Views (full-text article views including HTML views, PDF and ePub downloads, according to the available data) and Abstracts Views on Vision4Press platform.
Data correspond to usage on the plateform after 2015. The current usage metrics is available 48-96 hours after online publication and is updated daily on week days.
Initial download of the metrics may take a while.