Fig. 1
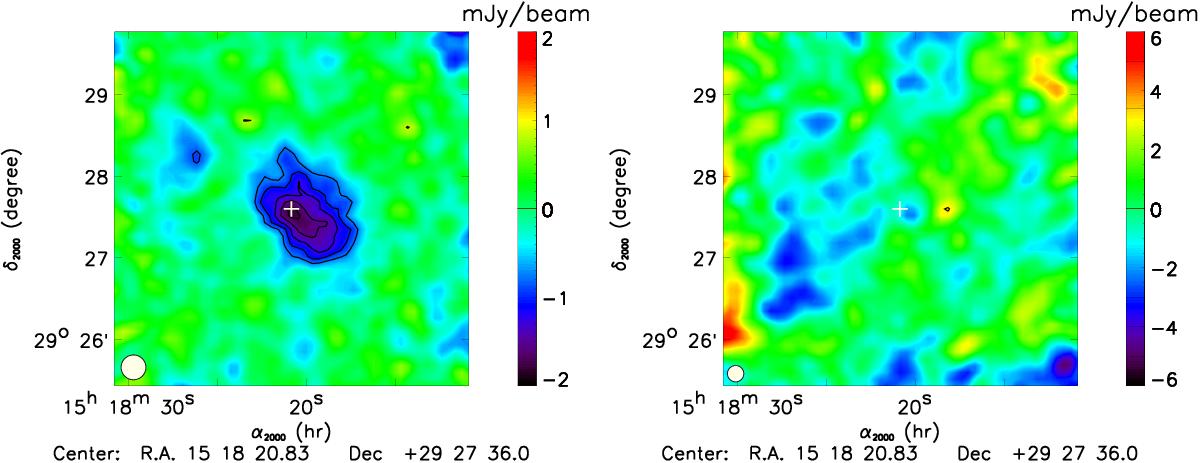
NIKA tSZ surface brightness maps at 150 GHz (left) and 260 GHz (right). The significance of the measured signal is given by the black contours starting at 3σ with 1σ spacing. The maps are smoothed with an additional 10 arcsec Gaussian filter for display purposes and the NIKA beam FWHMs are represented as white disks in the bottom left-hand corner of the maps. The white crosses indicate the X-ray center. Note that we use the original maps (without additional smoothing) in the following analysis.
Current usage metrics show cumulative count of Article Views (full-text article views including HTML views, PDF and ePub downloads, according to the available data) and Abstracts Views on Vision4Press platform.
Data correspond to usage on the plateform after 2015. The current usage metrics is available 48-96 hours after online publication and is updated daily on week days.
Initial download of the metrics may take a while.