Fig. 9
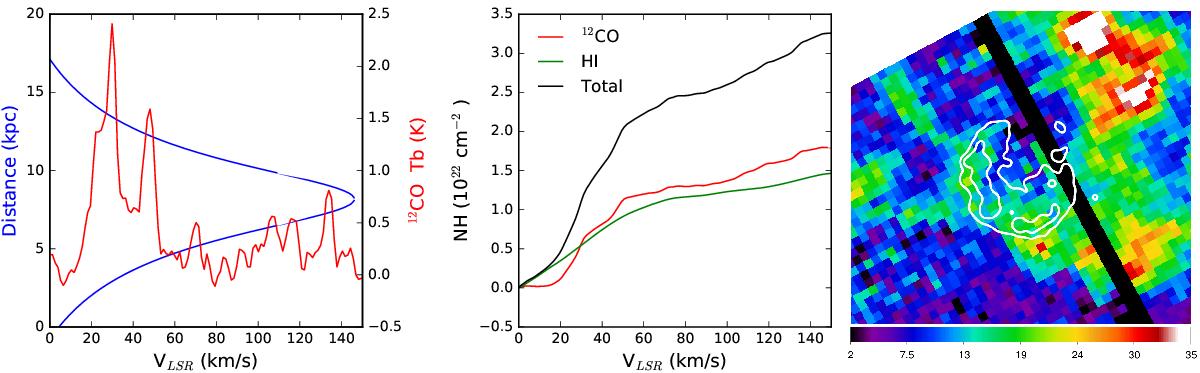
Left: 12CO spectrum at the position of the source (red) with corresponding kinematic distance (blue). Middle: H i, 12CO, and total column densities towards SNR G15.9+0.2 as a function of VLSR. Right: 13CO intensity map in the velocity range 18 km s-1 < VLSR < 32 km s-1, in units of K km s-1. X-ray contours are overlaid in white. The black stripe comes from bad columns which have been set to 0.
Current usage metrics show cumulative count of Article Views (full-text article views including HTML views, PDF and ePub downloads, according to the available data) and Abstracts Views on Vision4Press platform.
Data correspond to usage on the plateform after 2015. The current usage metrics is available 48-96 hours after online publication and is updated daily on week days.
Initial download of the metrics may take a while.