Fig. 8
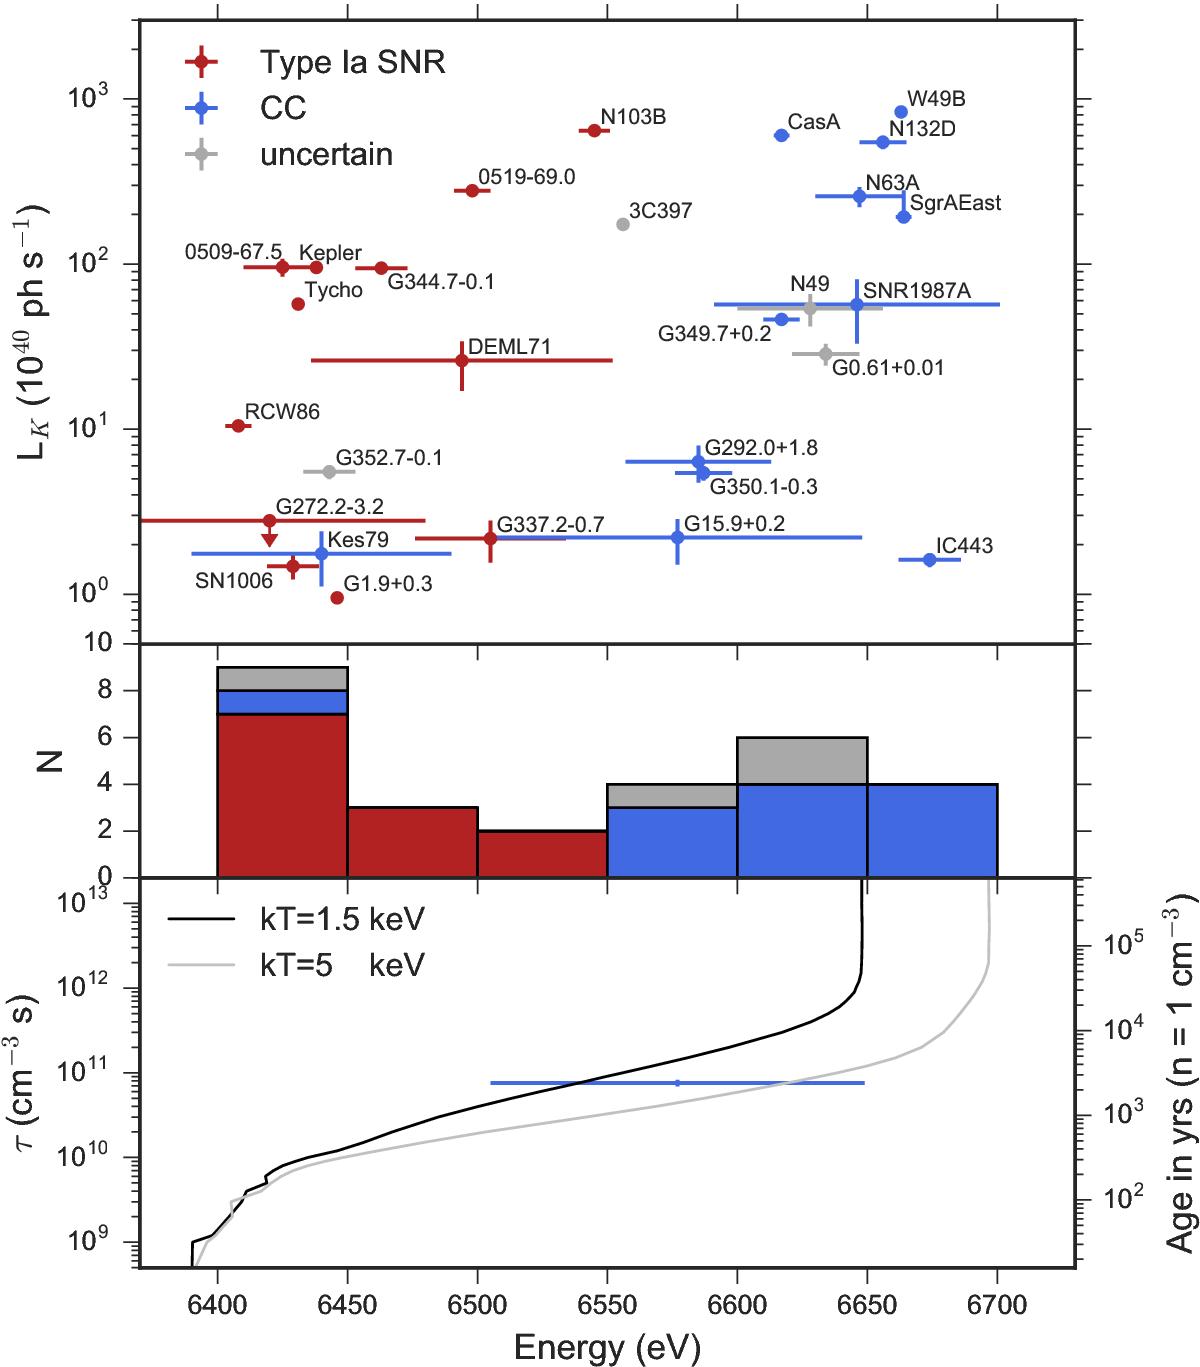
Top panel: centroid energy and luminosity of Fe K lines detected in SNRs. The main sample and values obtained with Suzaku are taken from Yamaguchi et al. (2014), augmented with XMM-Newton results for DEM L71 (Maggi et al. 2016) and SNR G15.9+0.2 (this work), and Suzaku observations of Kes 79 (Sato et al. 2016) and SNR G272.2−3.2 (Kamitsukasa et al. 2016). For the latter, only an upper limit is shown since the distance is poorly constrained (2 to 10 kpc, e.g. Harrus et al. 2001). Objects in red and blue are type Ia and CC SNRs, respectively. Those in grey are uncertain. Middle panel: histogram showing the distribution of Fe K centroid energy in SNRs using the same colour code as above. Bottom panel: expected centroid energy of the Fe K line in a vpshock model as function of τ, for kT = 1.5 keV (black) and 5 keV (grey). The best-fit τ and range of centroid energy of SNR G15.9+0.2 are indicated. The right-hand y-axis translates the ionisation timescale τ into an age, for a uniform ambient density of ne = 1 cm-3.
Current usage metrics show cumulative count of Article Views (full-text article views including HTML views, PDF and ePub downloads, according to the available data) and Abstracts Views on Vision4Press platform.
Data correspond to usage on the plateform after 2015. The current usage metrics is available 48-96 hours after online publication and is updated daily on week days.
Initial download of the metrics may take a while.