Fig. 5
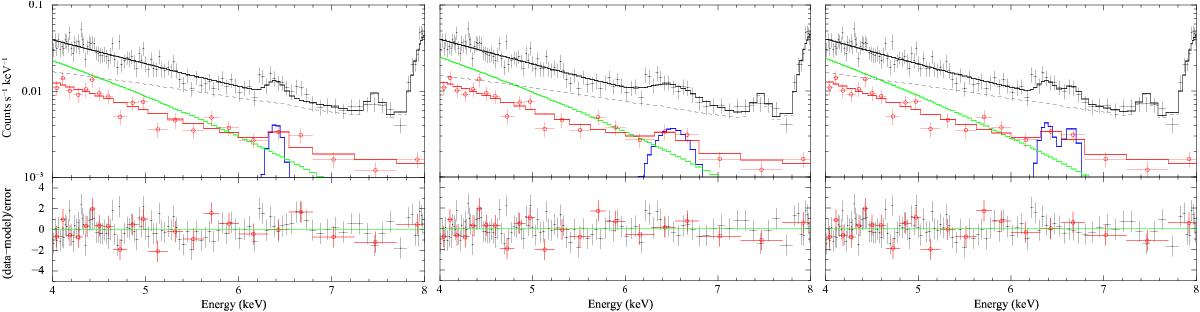
Spectrum of SNR G15.9+0.2 around 6.4 keV. The bremsstrahlung continuum is shown in green, Fe K emission in blue. Black points and line are the pn data and best-fit model, respectively. All other background contributions are shown by the dashed black line. As in Fig. 3, we only show one example for MOS (red). Residuals are displayed in the bottom panels. Models used for the iron emission (from left to right): Gaussian with width fixed to zero, Gaussian with free width, two Gaussians with width fixed to zero. See best-fit parameters in Table 4.
Current usage metrics show cumulative count of Article Views (full-text article views including HTML views, PDF and ePub downloads, according to the available data) and Abstracts Views on Vision4Press platform.
Data correspond to usage on the plateform after 2015. The current usage metrics is available 48-96 hours after online publication and is updated daily on week days.
Initial download of the metrics may take a while.