Fig. 4
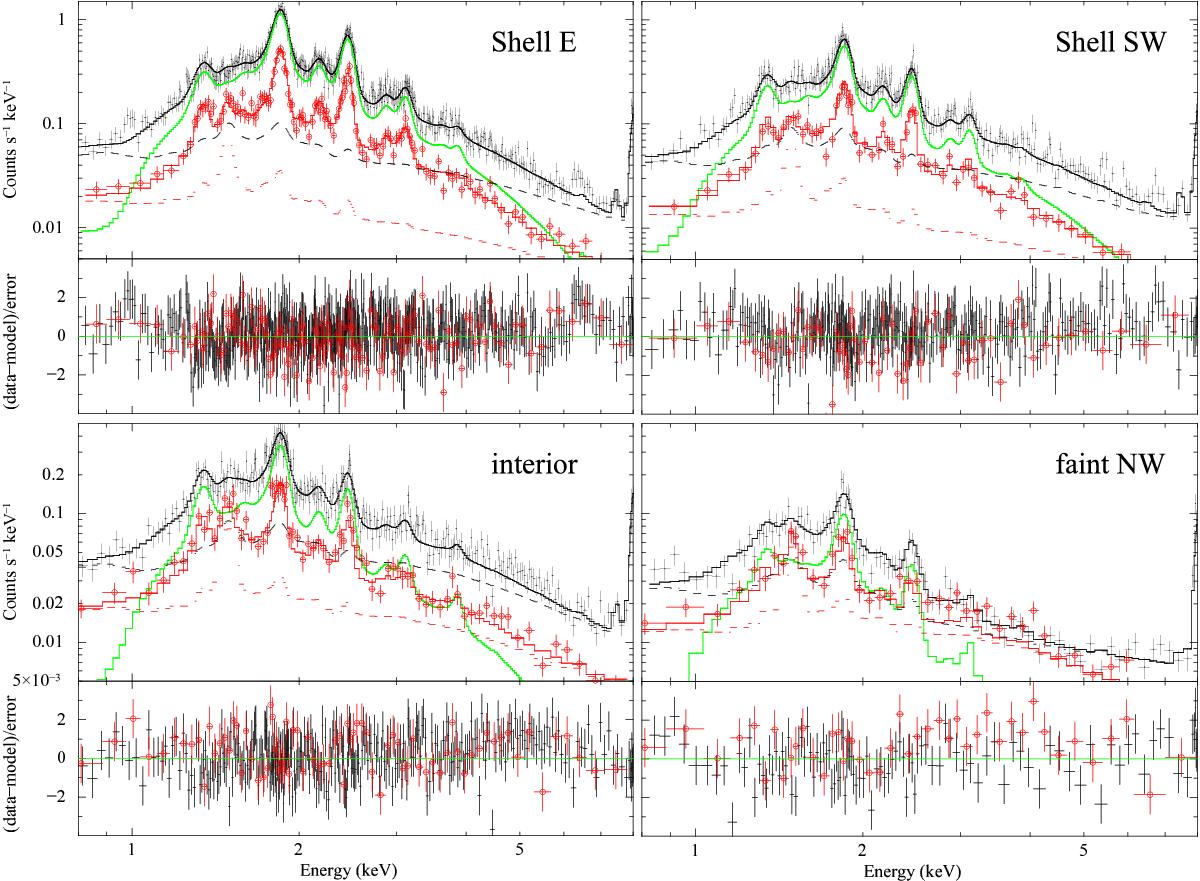
X-ray spectra from various regions of SNR G15.9+0.2, with pn and MOS2 data from the 2008 observation in black and red, respectively. All background components are included in the dashed lines (model from Fig. 3, plus straylight contamination, see Sect. 3.2). The best-fit fiducial model for the SNR emission is in green, with corresponding residuals in the bottom panels. We note the changing vertical scale between rows.
Current usage metrics show cumulative count of Article Views (full-text article views including HTML views, PDF and ePub downloads, according to the available data) and Abstracts Views on Vision4Press platform.
Data correspond to usage on the plateform after 2015. The current usage metrics is available 48-96 hours after online publication and is updated daily on week days.
Initial download of the metrics may take a while.