Fig. 3
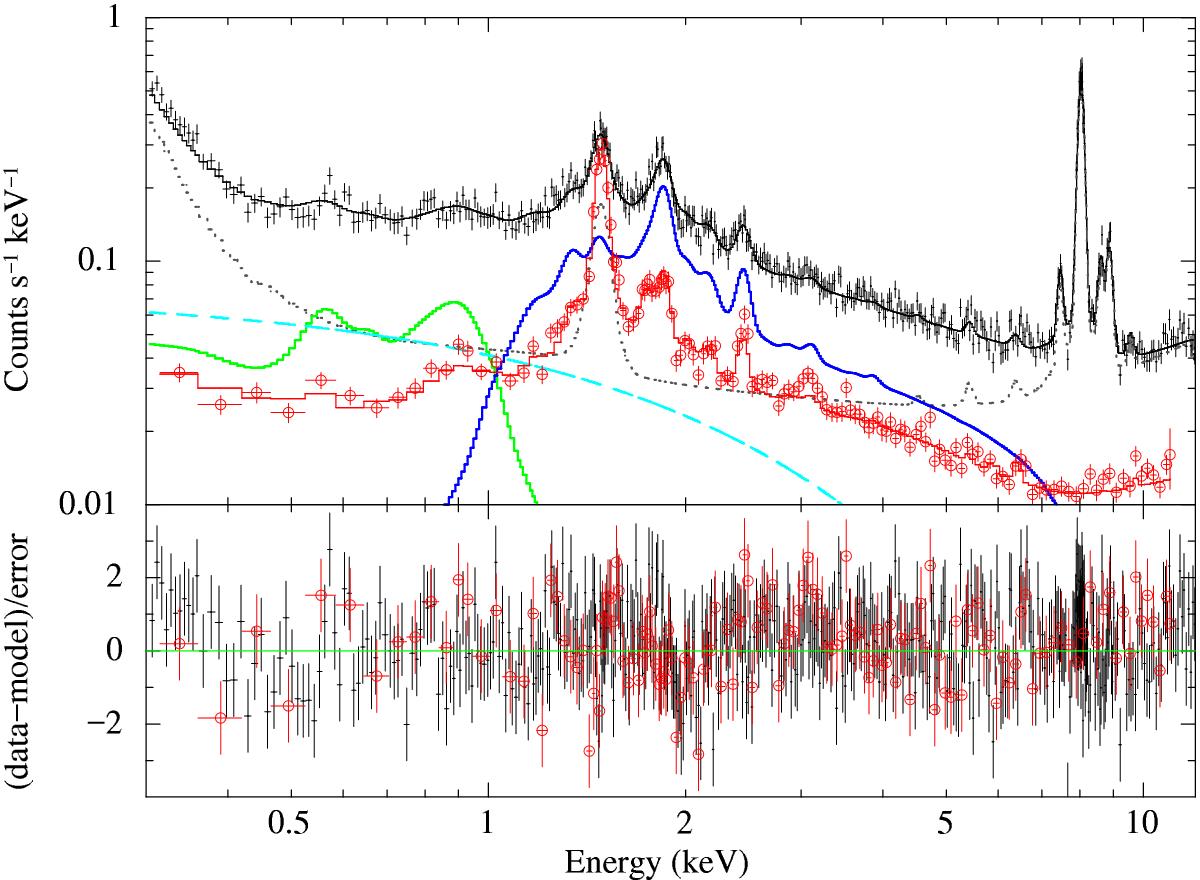
Background spectrum of SNR G15.9+0.2. For the sake of clarity, only pn and MOS2 data from the 2008 observation are shown (black and red points, respectively). Data have been rebinned for display purposes. The various components are instrumental background (dotted grey), local background (solid green), remote background and CXB (solid blue) and SPC (dashed cyan). Fit residuals are displayed in the bottom panel.
Current usage metrics show cumulative count of Article Views (full-text article views including HTML views, PDF and ePub downloads, according to the available data) and Abstracts Views on Vision4Press platform.
Data correspond to usage on the plateform after 2015. The current usage metrics is available 48-96 hours after online publication and is updated daily on week days.
Initial download of the metrics may take a while.