Fig. 7
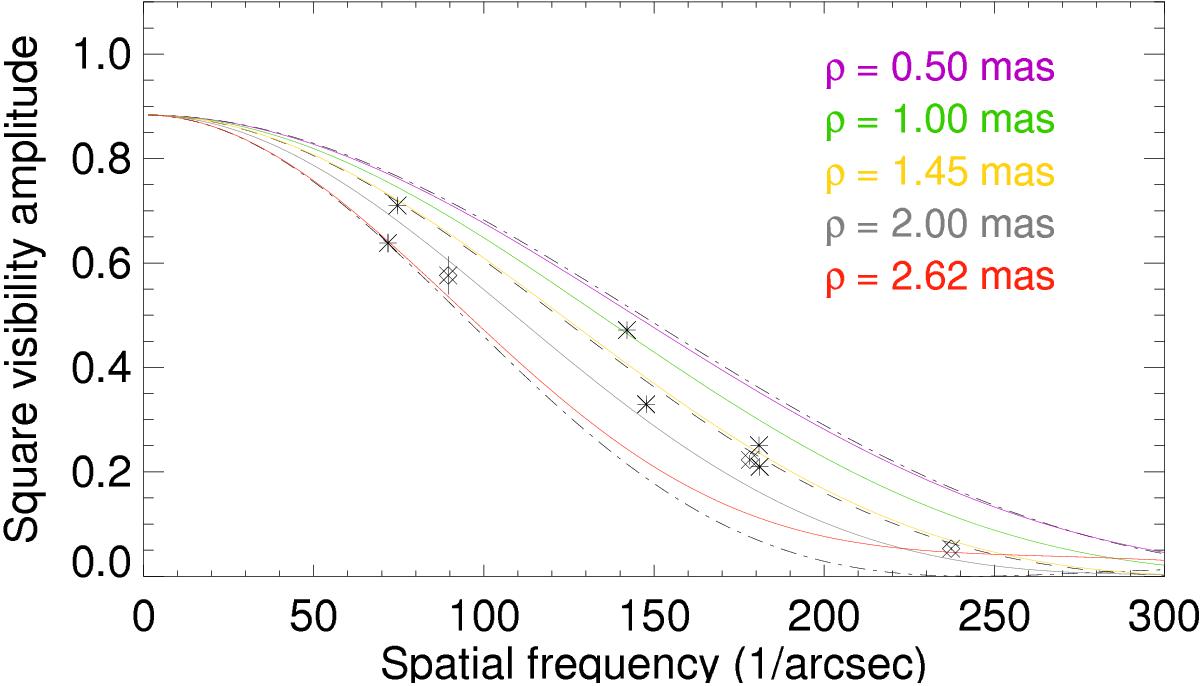
Influence of the close companion of V766 Cen on the visibility curve. The asterisk and diamond symbols denote our near-continuum (2.05–2.20 μm) data, the central dashed line denotes the best-fit UD with over-resolved component, and the dash-dotted lines the error of the UD diameter. The color curves show the synthetic visibilities of a binary toy model consisting of two UDs and an over-resolved component with flux ratios as derived by Chesneau et al. (2014). The different colors indicate different positions of the companion corresponding along the projected orbit. The figure illustrates that our observations cannot separate between these curves and thus cannot fully characterize the companion. The range of the visibility curves of our binary toy model are within our already adopted diameter error.
Current usage metrics show cumulative count of Article Views (full-text article views including HTML views, PDF and ePub downloads, according to the available data) and Abstracts Views on Vision4Press platform.
Data correspond to usage on the plateform after 2015. The current usage metrics is available 48-96 hours after online publication and is updated daily on week days.
Initial download of the metrics may take a while.